
The Reports module brings together financial and operational data from across Upvoit into ready-to-use reports. Use it to track income, monitor outstanding payments and review team activity.
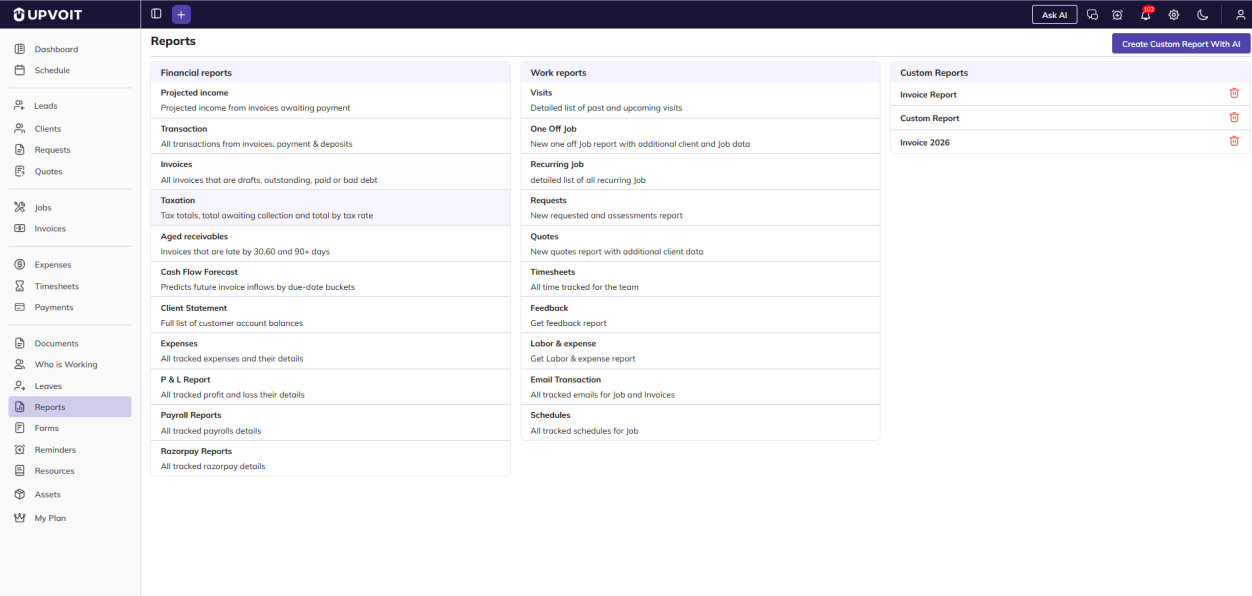
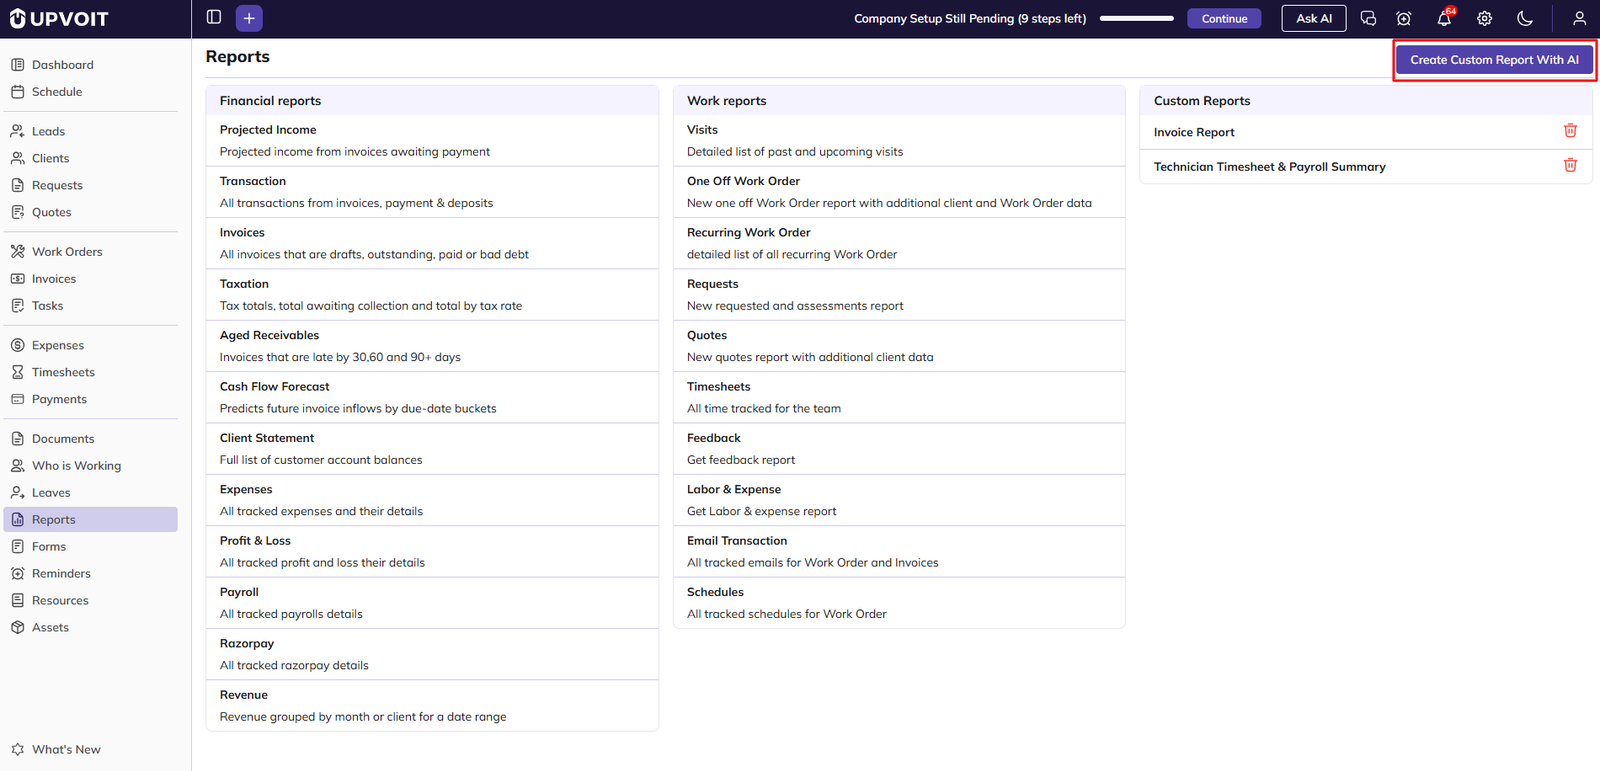
The Reports page shows three groups:
-
Financial reports: Predefined reports on invoices, payments, tax, expenses, profit and payroll.
-
Work reports: Predefined reports on visits, jobs, requests, quotes, timesheets and team activity.
-
Custom Reports: Reports you create using AI.
Accessing Reports
Click Reports in the left navigation menu.
Financial Reports
Projected Income Report
Shows the income you can expect from invoices that are still awaiting payment.
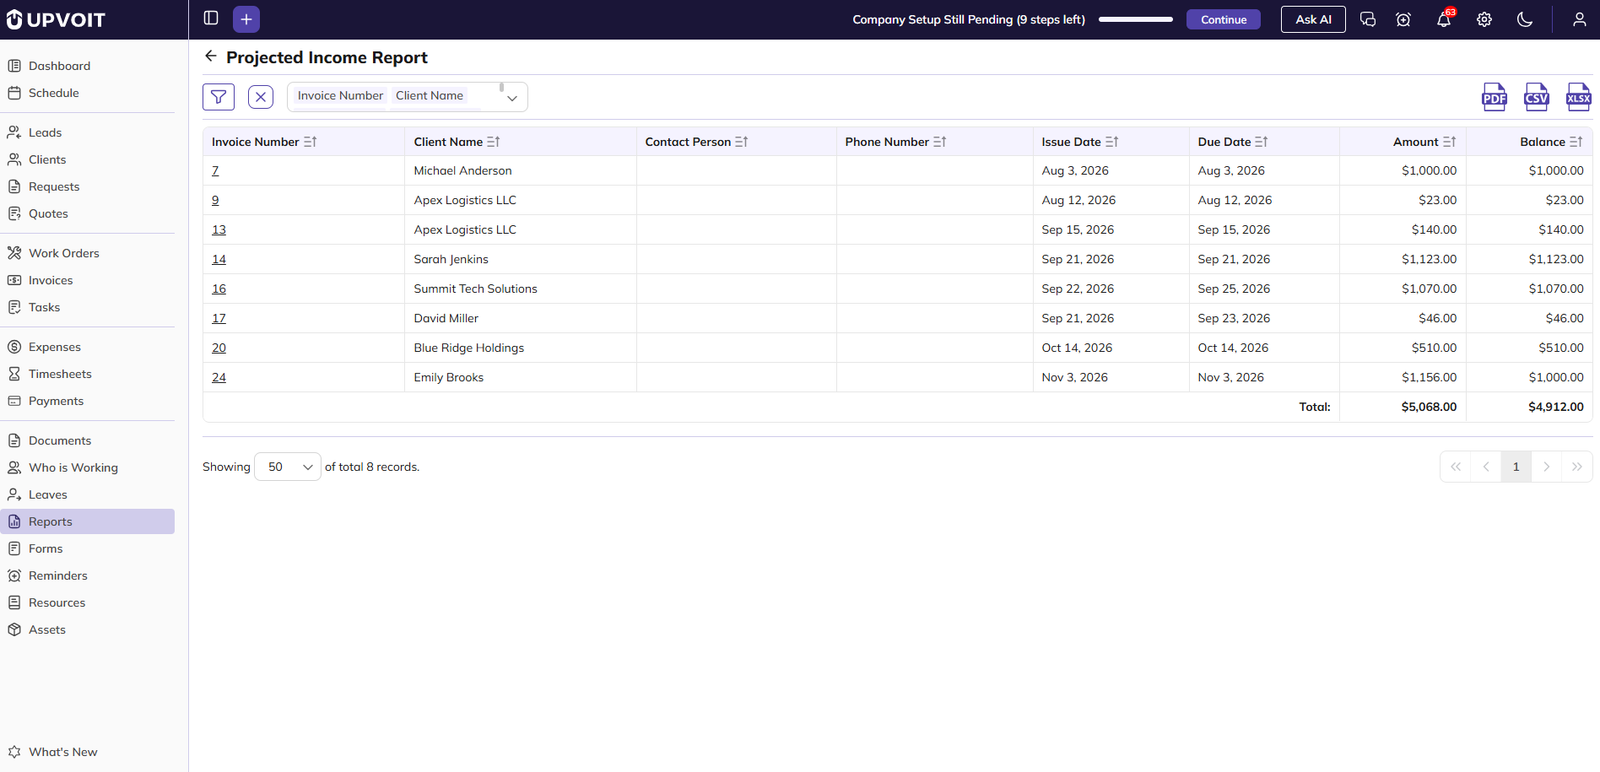
The report lists each unpaid invoice with its client, dates, amount and balance.
-
Invoice Number: Click to open the invoice.
-
Balance: The amount still unpaid on the invoice.
-
Total: The combined Amount and Balance of all listed invoices, shown at the bottom.
You can also use these controls on the report page:
-
Sort: Click the sort icon on a column header.
-
Export: Download the report as PDF, CSV or XLSX. Only the selected columns are exported.
-
Records per page: Show 20, 50 or 100 records per page.
Filtering the report:
-
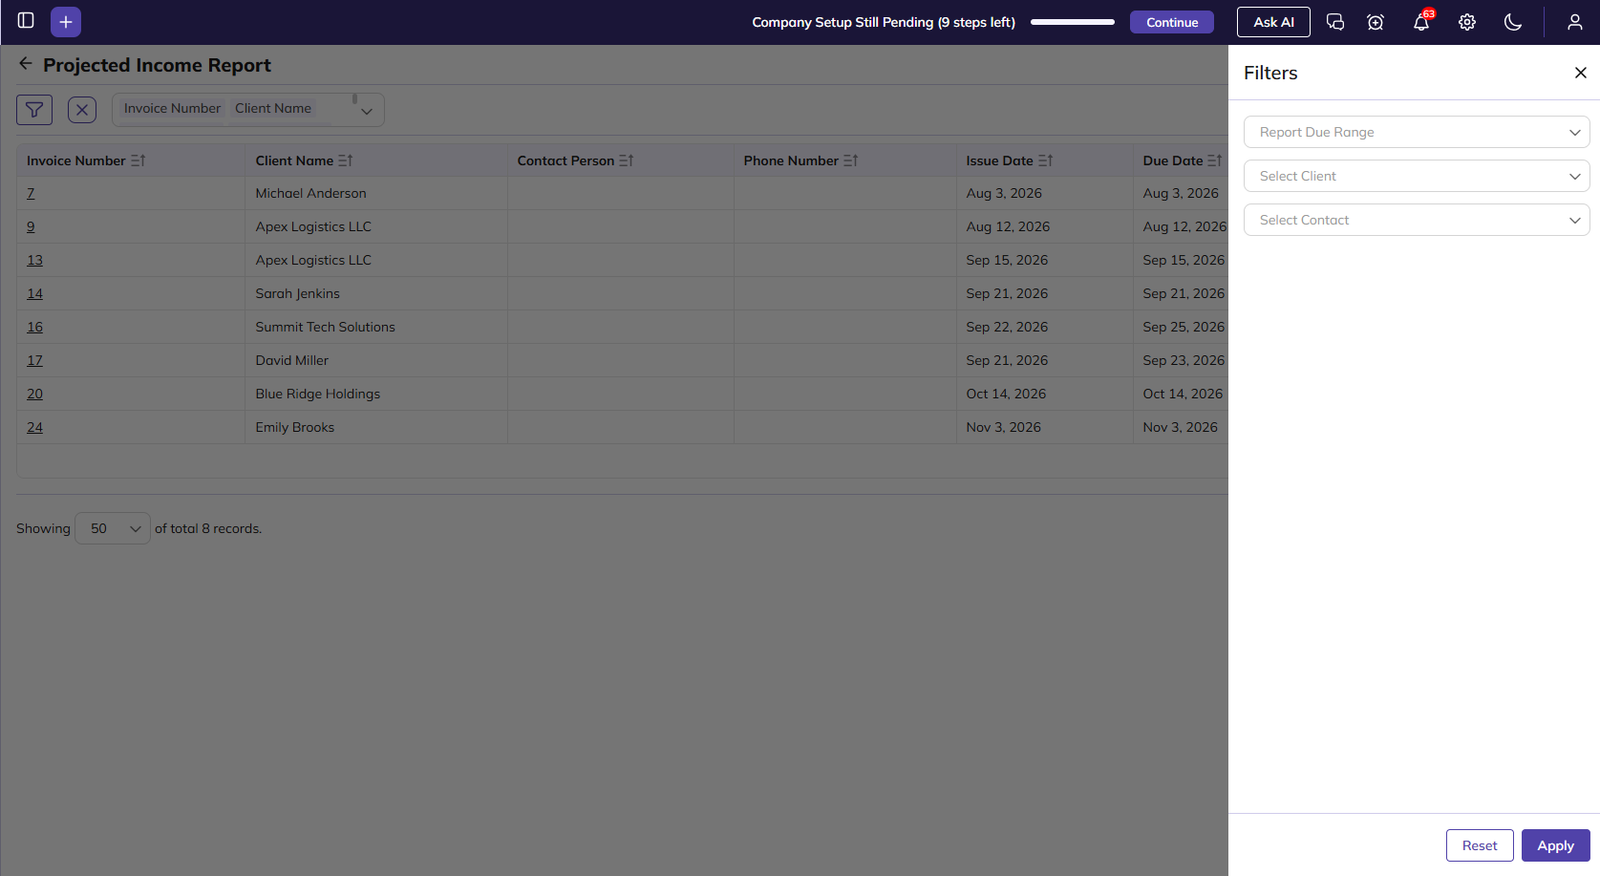
Click the Filter icon.
-
Set any of these filters:
-
Report Due Range: Show invoices due within a selected period. Custom date ranges are not supported.
-
Select Client
-
Select Contact
-
-
Click Apply.
-
To clear the filters, click Reset or the X icon.
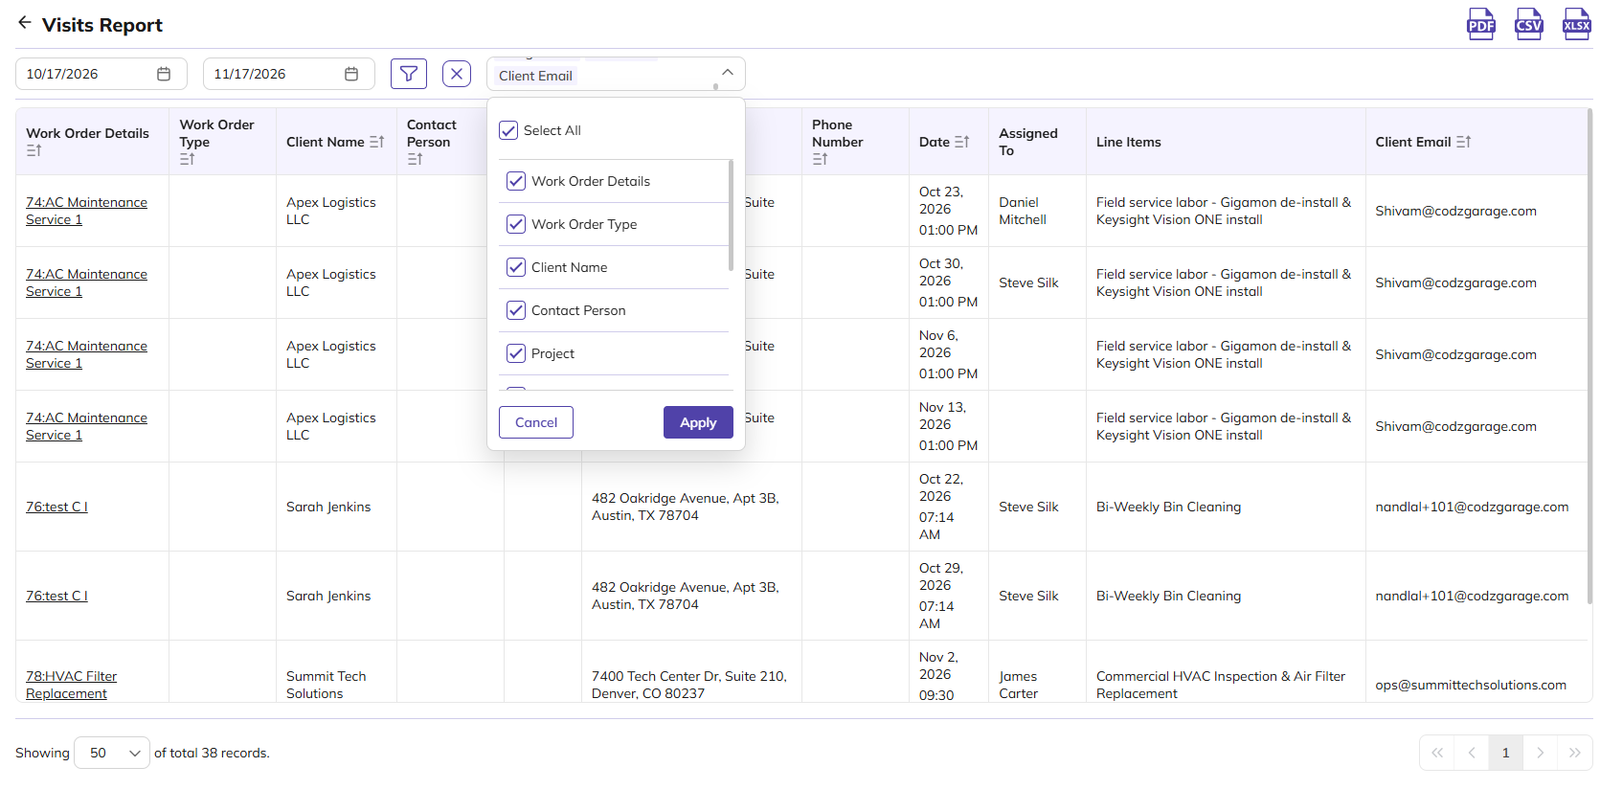
Choosing columns:
-
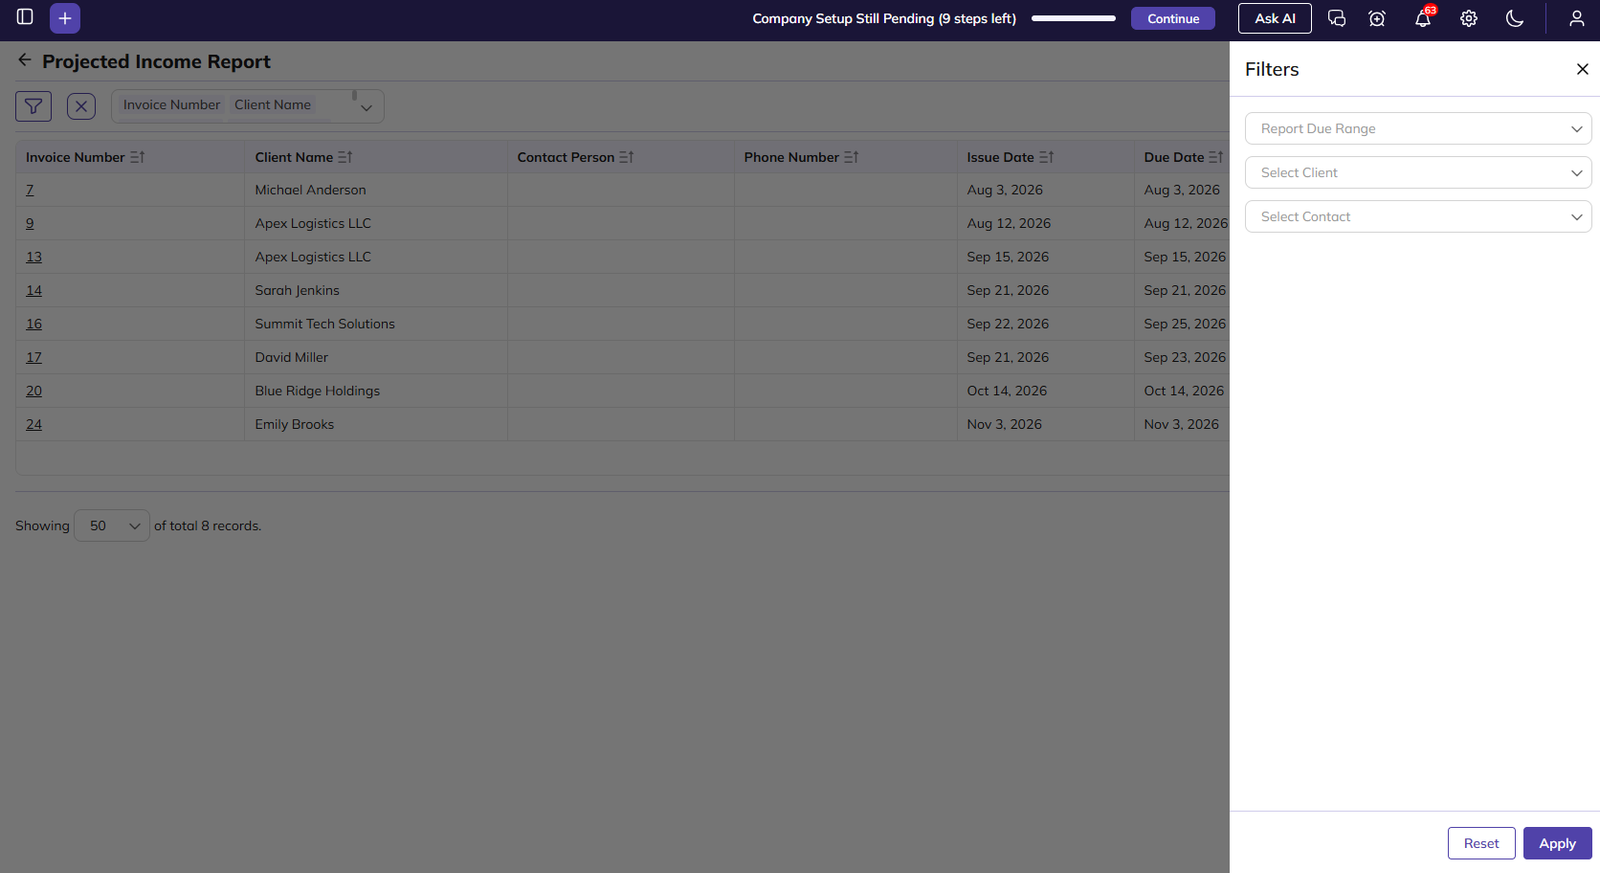
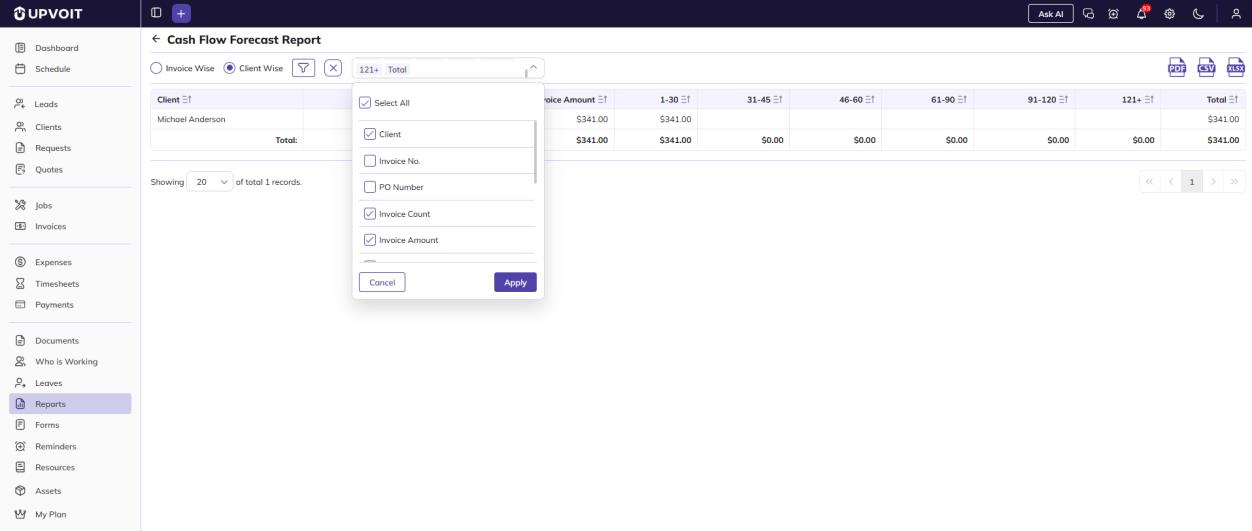
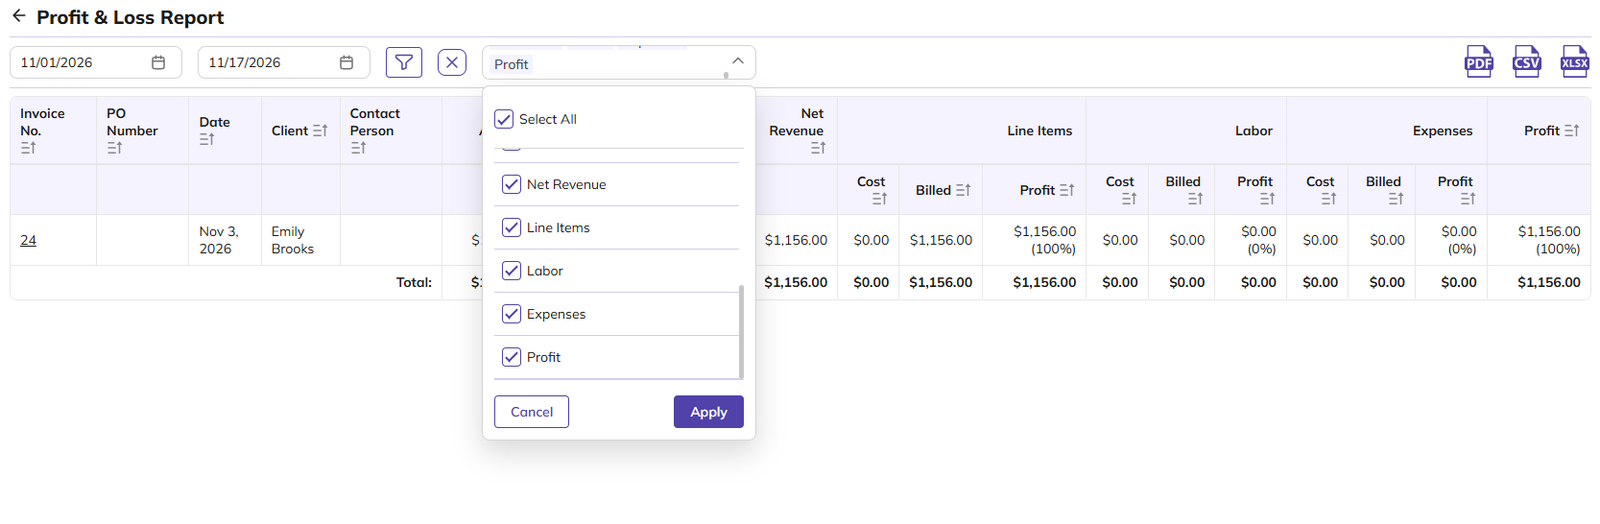
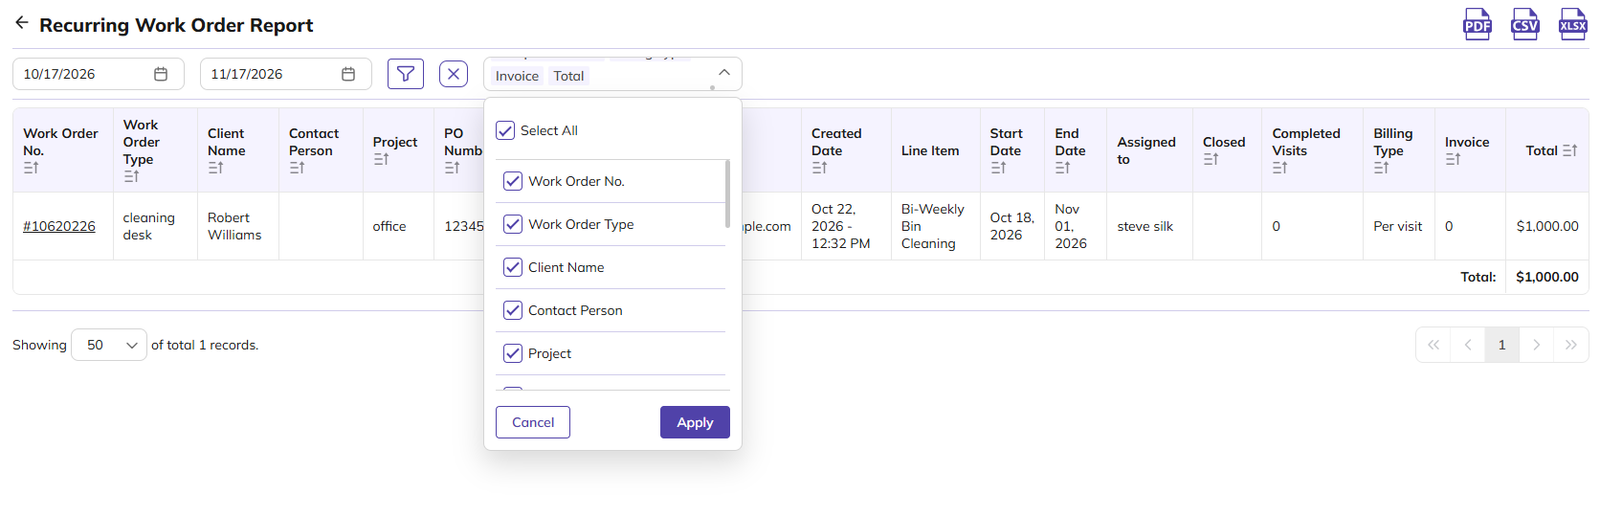
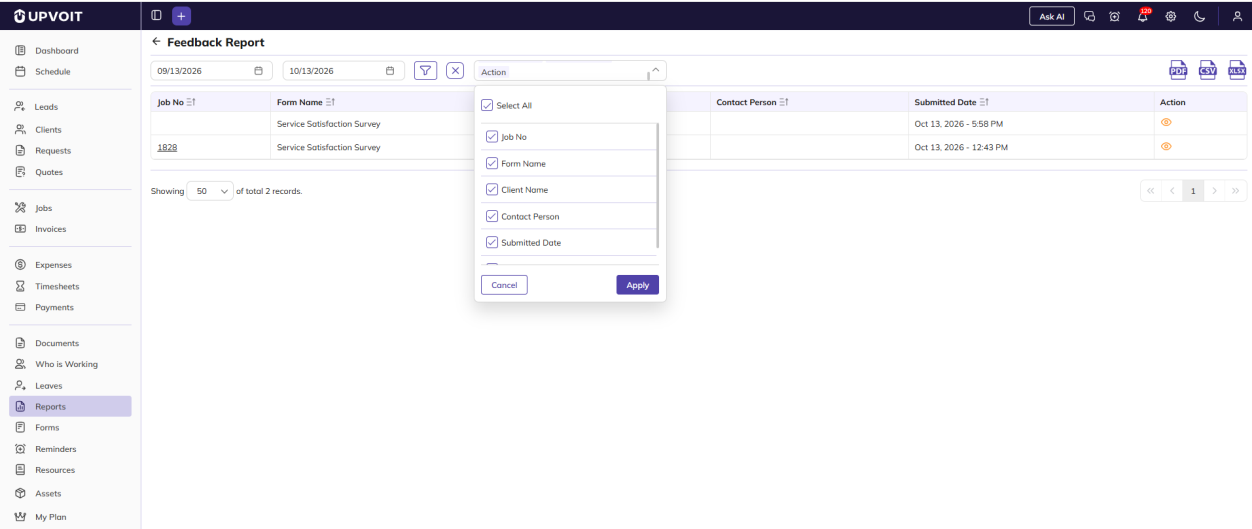
Click the column dropdown next to the X icon.
-
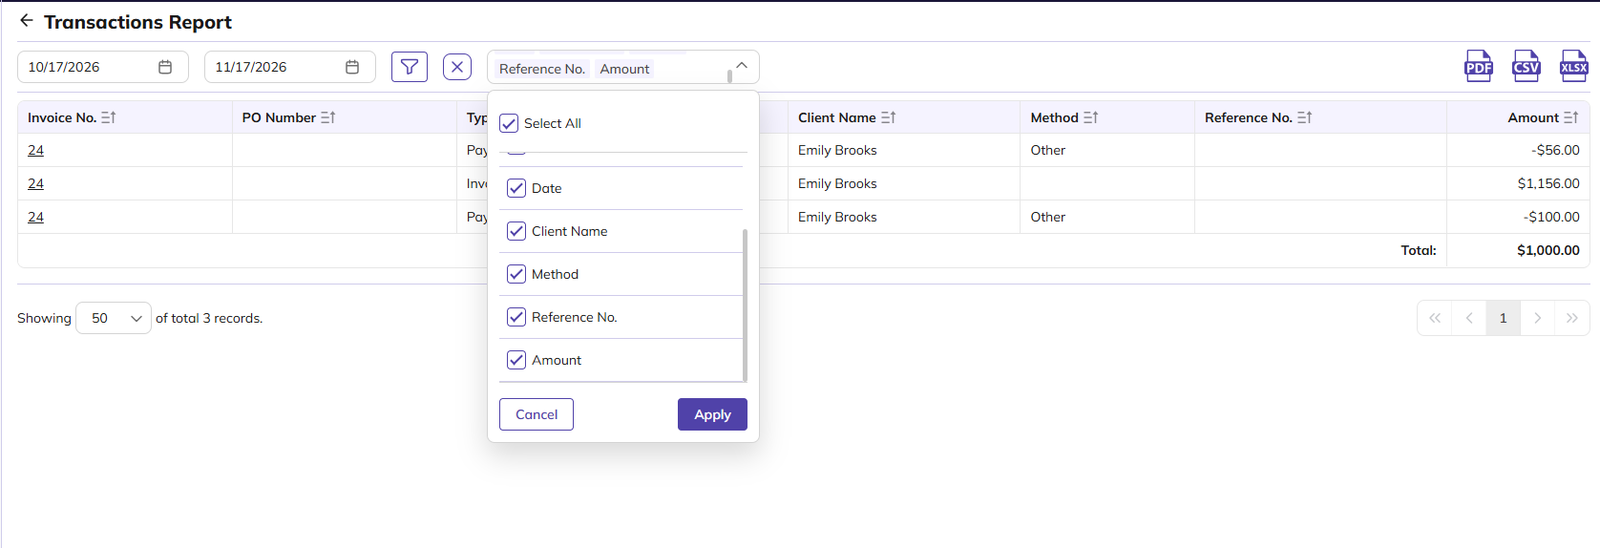
Select or clear the columns you want. Phone Number is hidden by default.
-
Click Apply.
Transaction Report
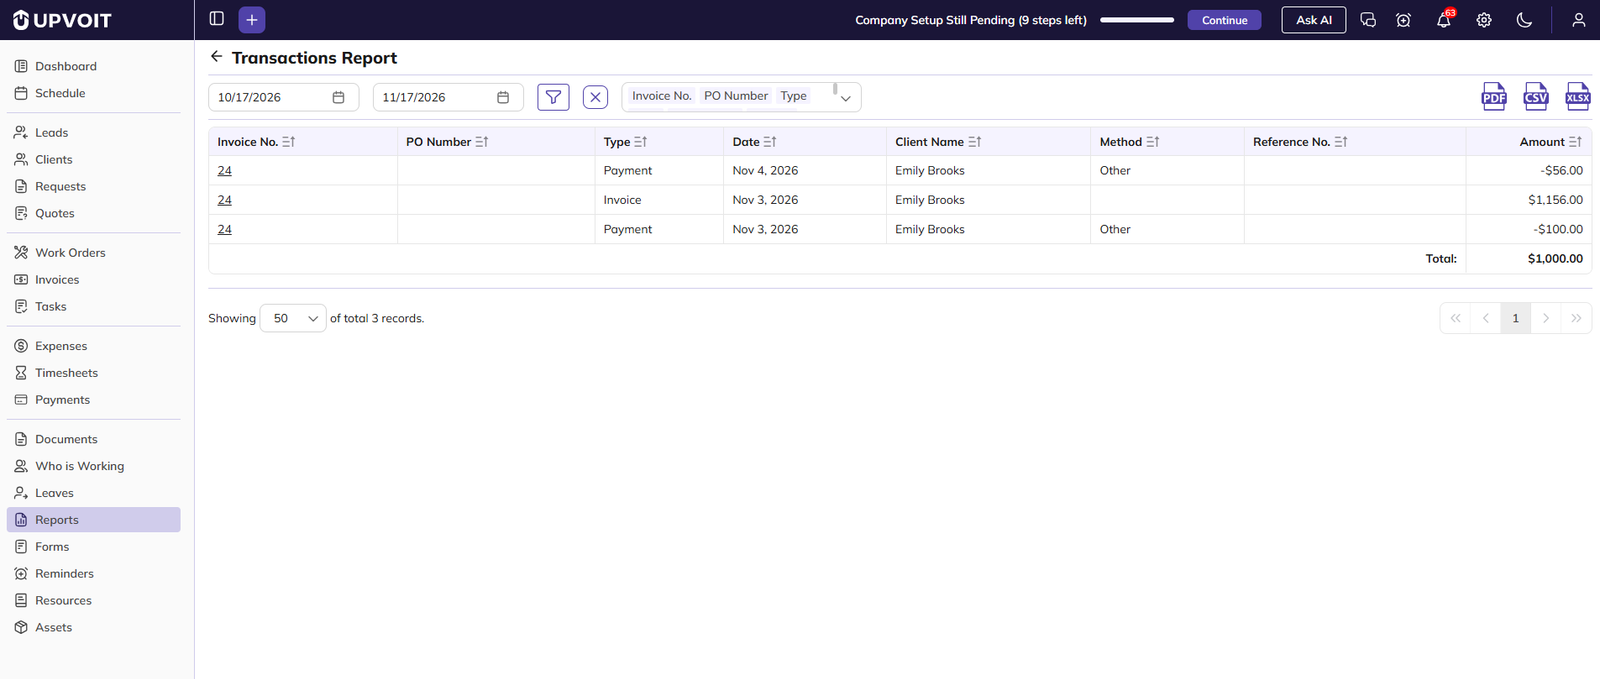
Shows all transactions from invoices, payments and deposits within a selected date range.
-
Date range: By default, the report shows the last one month up to today. Change the start and end dates at the top left to view a different period.
-
Invoice No.: Click to open the invoice. This column is blank for payments made against bulk invoices.
-
Type: Shows whether the entry is an Invoice, Payment or Deposit.
-
Method: The payment method used, such as GPay, Stripe or Square.
-
Reference No.: The reference entered when the payment was recorded.
-
Amount: A positive amount is the invoice total. A negative amount is a payment or deposit received against the invoice.
-
Total: The net amount of all listed transactions, shown at the bottom.
You can also use these controls on the report page:
-
Sort: Click the sort icon on a column header.
-
Export: Download the report as PDF, CSV or XLSX. Only the selected columns are exported.
-
Records per page: Show 20, 50 or 100 records per page.
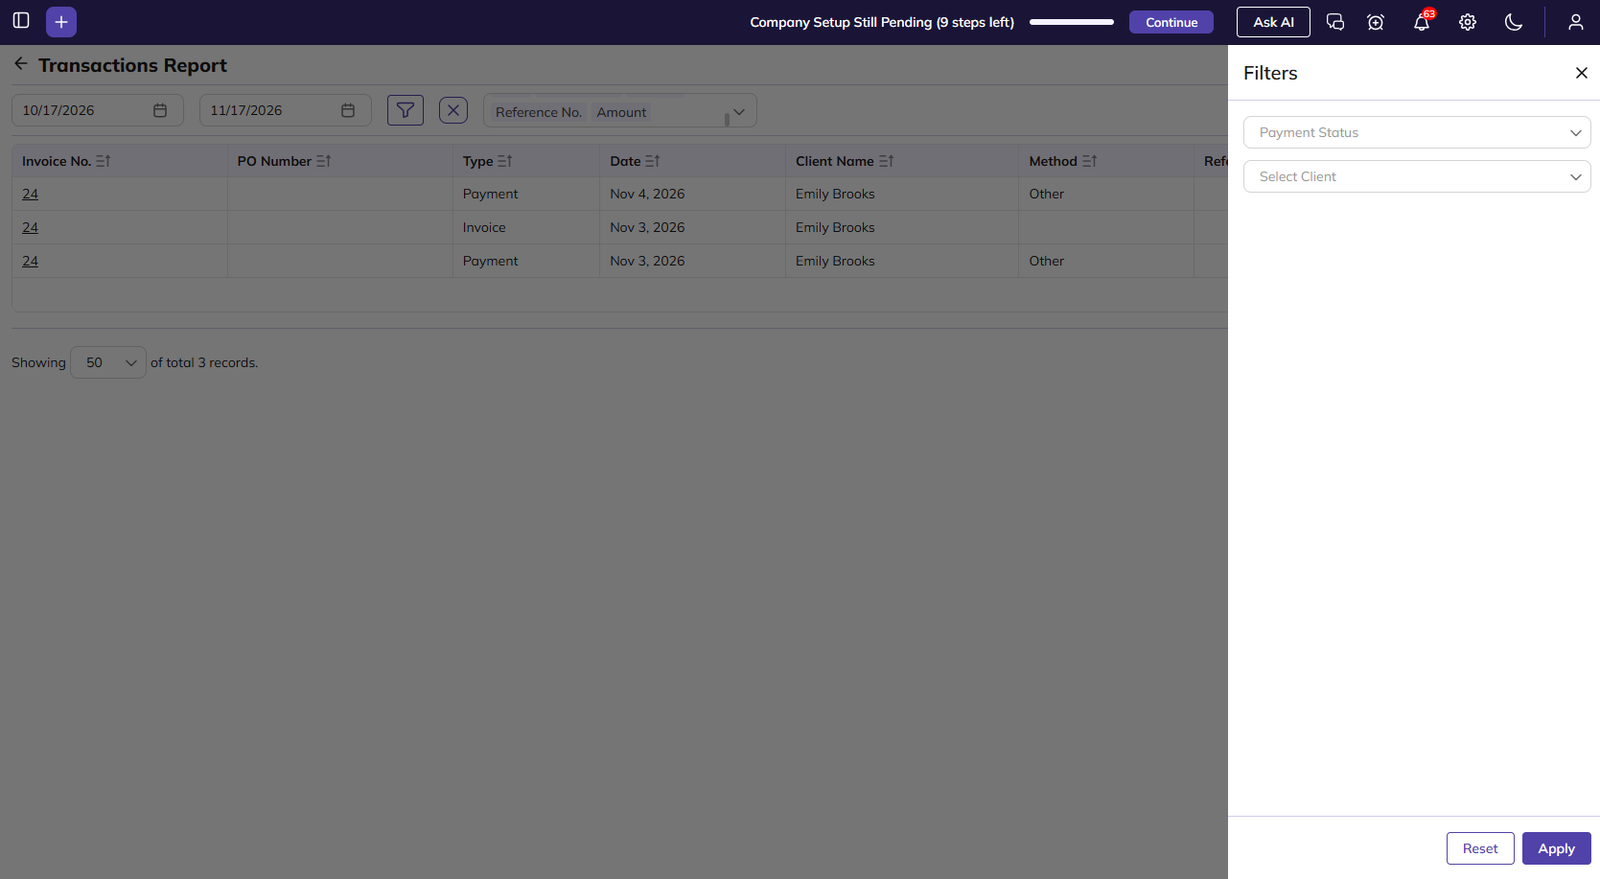
Filtering the report:
-
Click the Filter icon.
-
Set any of these filters:
-
Payment Status: Select Paid or Deposit to show payments and deposits, or Invoiced to show invoices.
-
Select Client
-
-
Click Apply.
-
To clear the filters, click Reset or the X icon.
Invoices Report
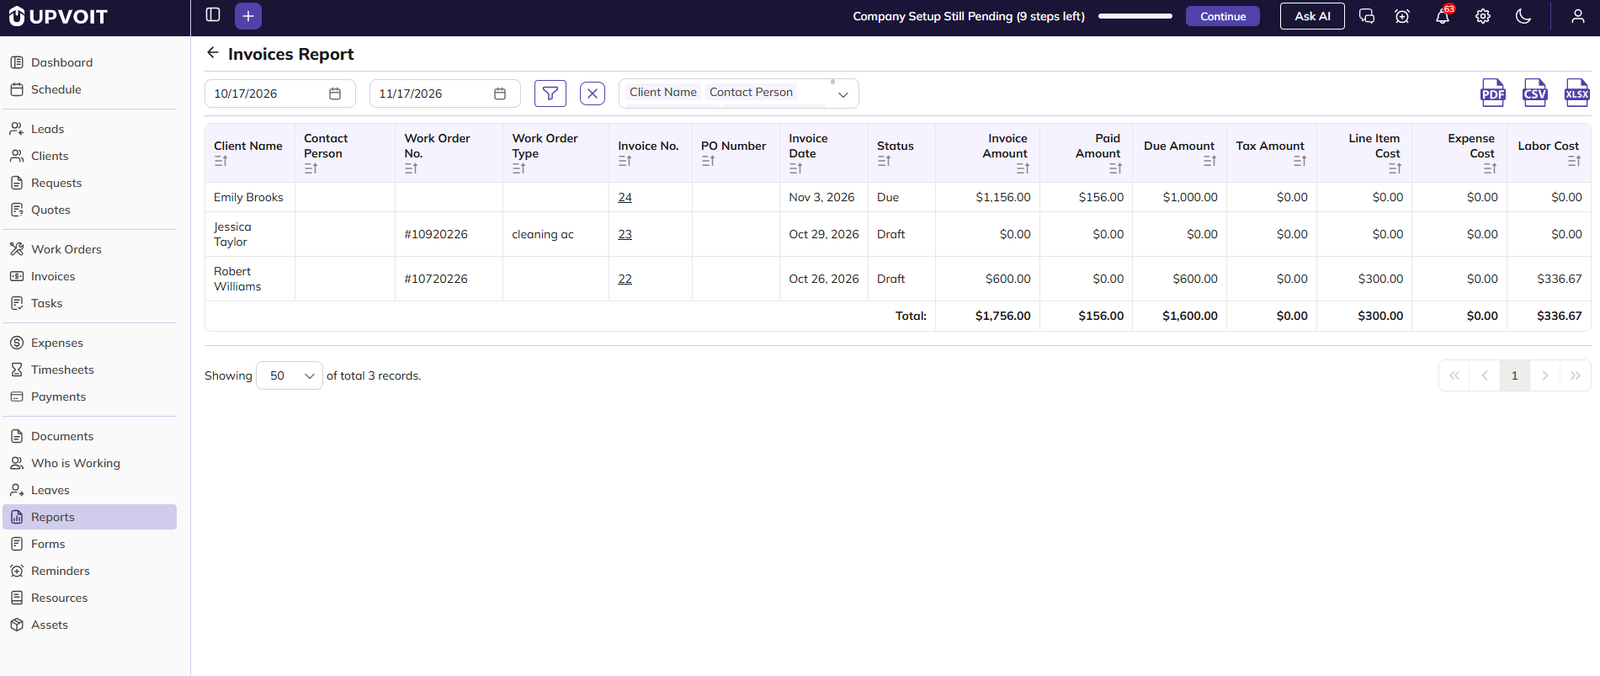
Shows all invoices with their status and payment details within a selected date range.
-
Date range: By default, the report shows the last one month up to today. Change the start and end dates at the top left to view a different period.
-
Invoice No.: Click to open the invoice.
-
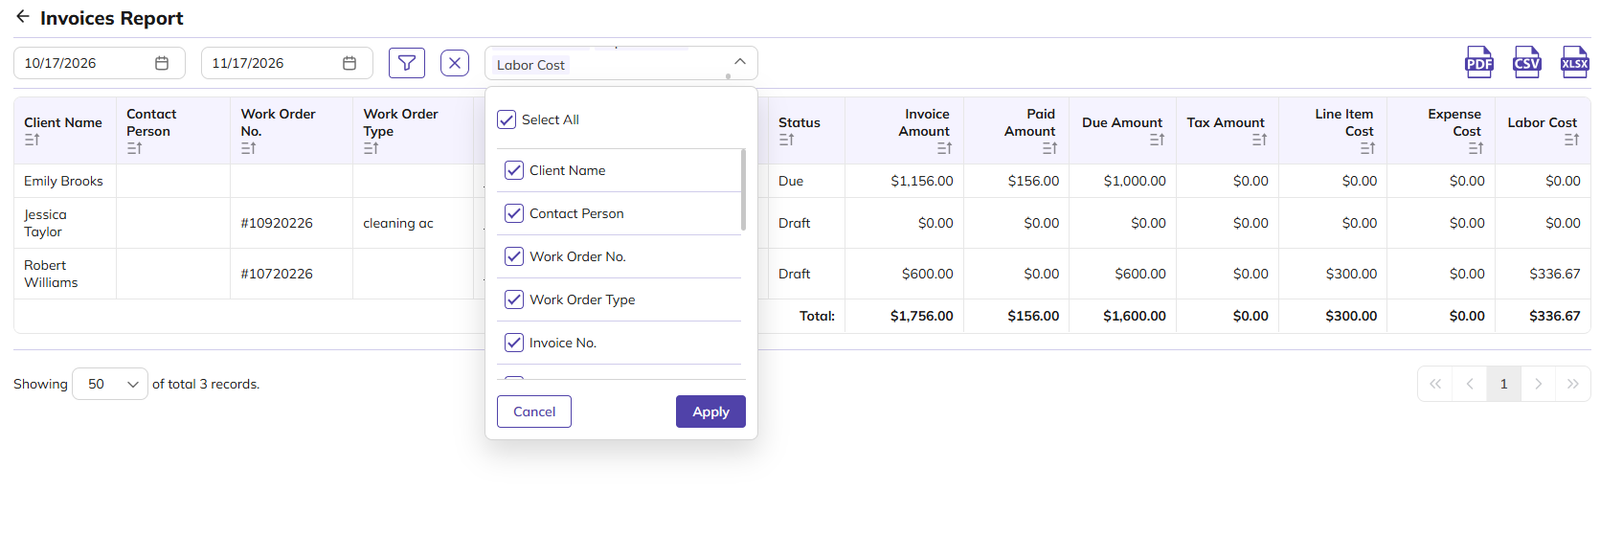
Status: The current invoice status, such as Draft, Awaiting Payments, Not Yet Due, Due, Paid, Void or Cancel.
-
Paid Amount: The amount received against the invoice so far.
-
Due Amount: The amount still unpaid on the invoice.
-
Total: The combined Invoice Amount, Paid Amount and Due Amount of all listed invoices, shown at the bottom.
You can also use these controls on the report page:
-
Sort: Click the sort icon on a column header.
-
Export: Download the report as PDF, CSV or XLSX. Only the selected columns are exported.
-
Records per page: Show 20, 50 or 100 records per page.
The following columns are hidden by default and can be added from the column dropdown: Contact Person, Job No., Job Type, PO Number, Tax Amount, Line Item Cost, Expense Cost and Labor Cost.
Filtering the report:
-
Click the Filter icon.
-
Set any of these filters:
-
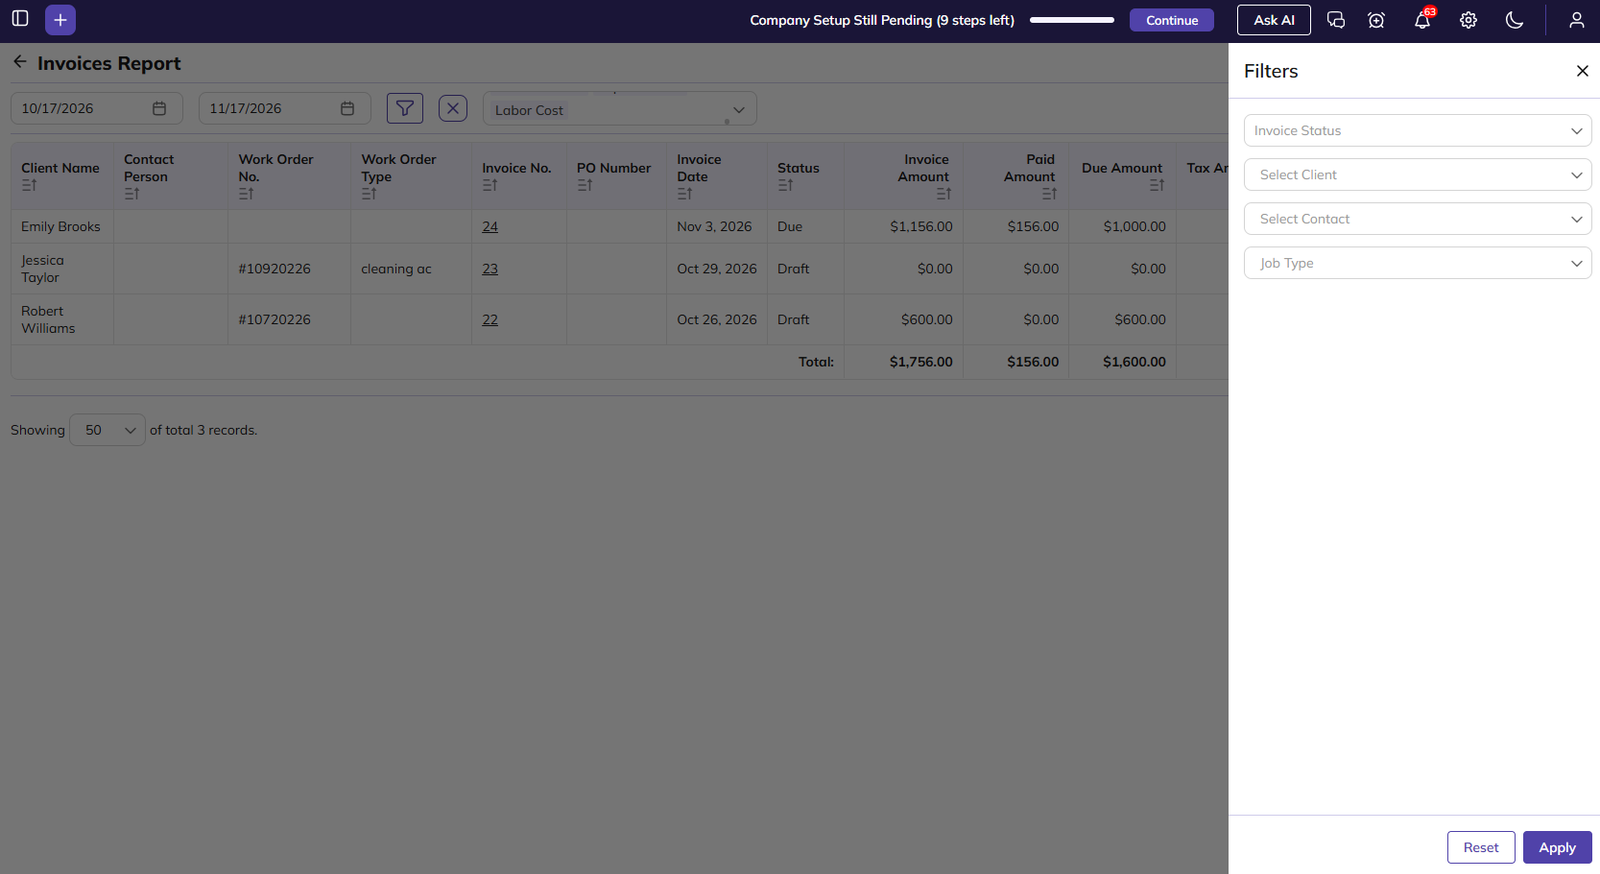
Invoice Status: Awaiting Payments, Not Yet Due, Due, Paid, Void or Cancel.
-
Select Client
-
Select Contact
-
Job Type: The job types set up under Settings > Job Type.
-
-
Click Apply.
-
To clear the filters, click Reset or the X icon.
Taxation Report
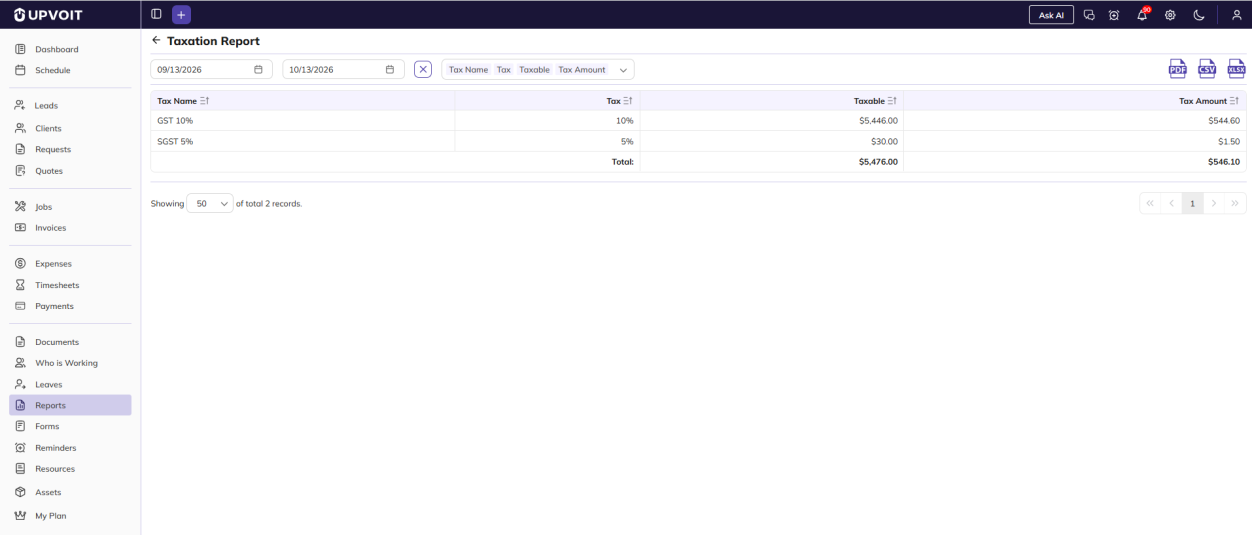
Shows the tax applied on invoices within a selected date range, grouped by tax rate. Draft invoices are not included.
-
Date range: By default, the report shows the last one month up to today. Change the start and end dates at the top left to view a different period, or click the X icon to clear the selected dates.
-
Tax Name / Tax: The name and rate of the tax applied on the invoices. Tax rates are set up under Settings > Taxes.
-
Taxable: The total invoice amount on which the tax was applied.
-
Tax Amount: The tax calculated on the taxable amount.
-
Total: The combined Taxable and Tax Amount for all tax rates, shown at the bottom.
You can also use these controls on the report page:
-
Sort: Click the sort icon on a column header.
-
Export: Download the report as PDF, CSV or XLSX. Only the selected columns are exported.
-
Records per page: Show 20, 50 or 100 records per page.
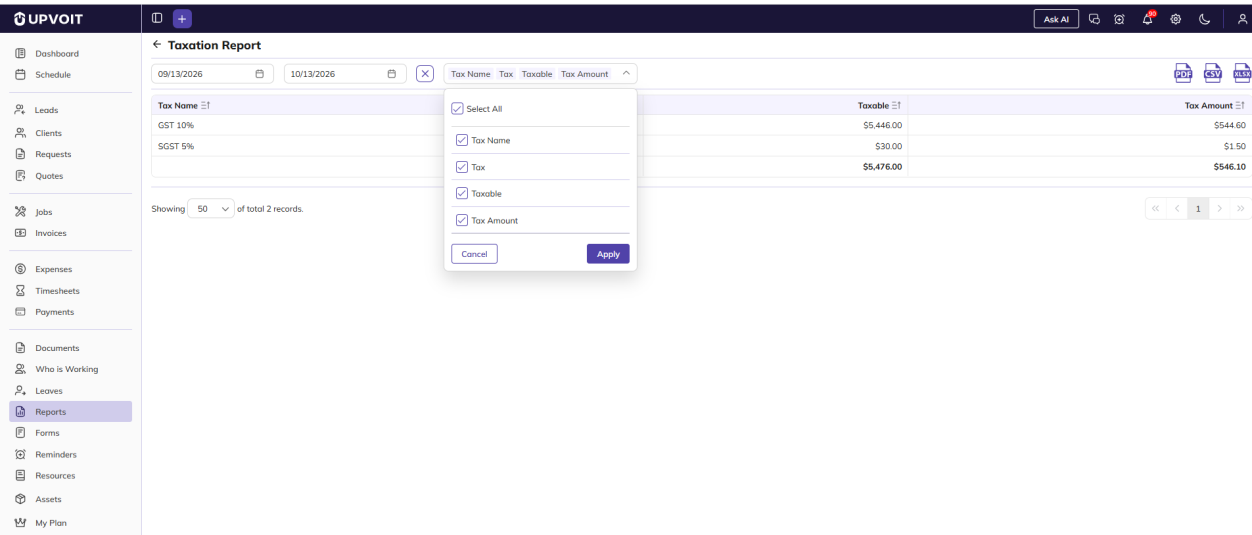
This report has no filters.
Aged Receivables Report
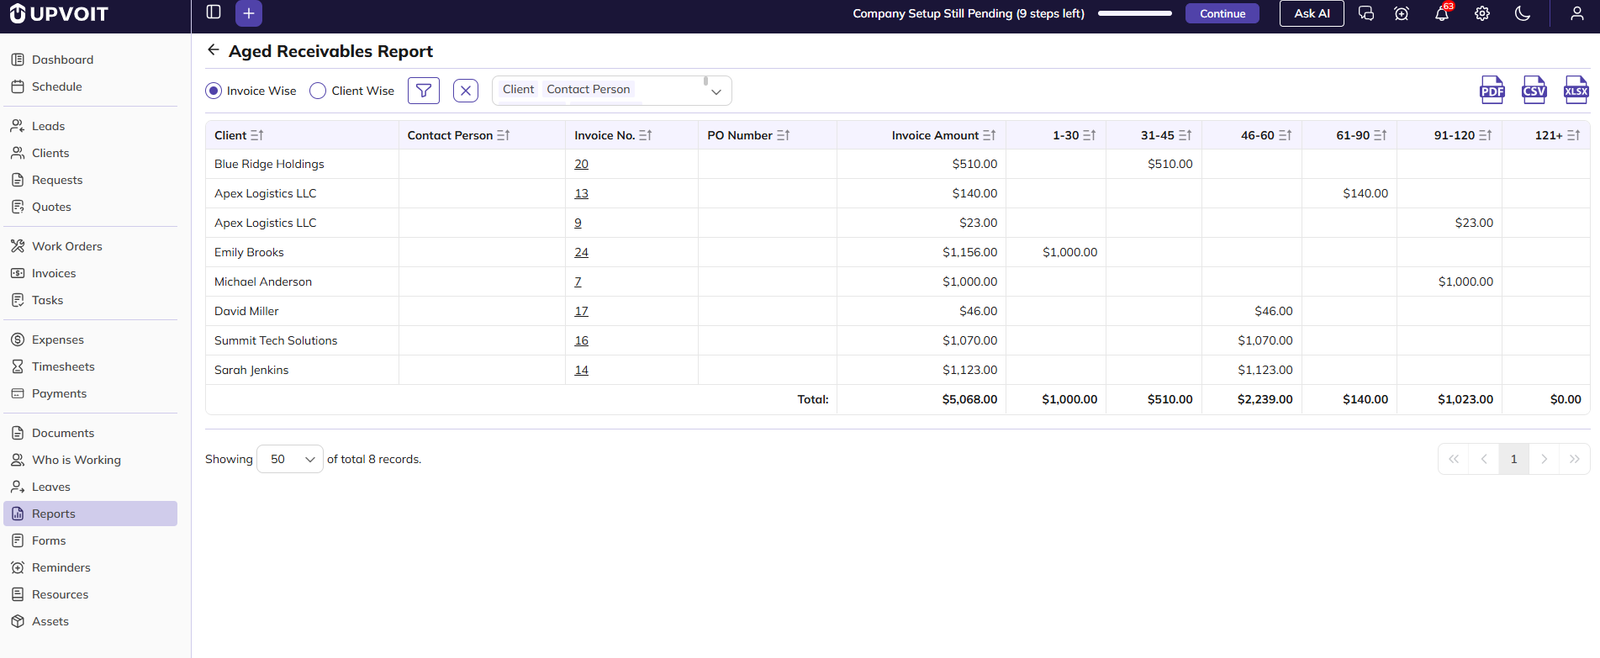
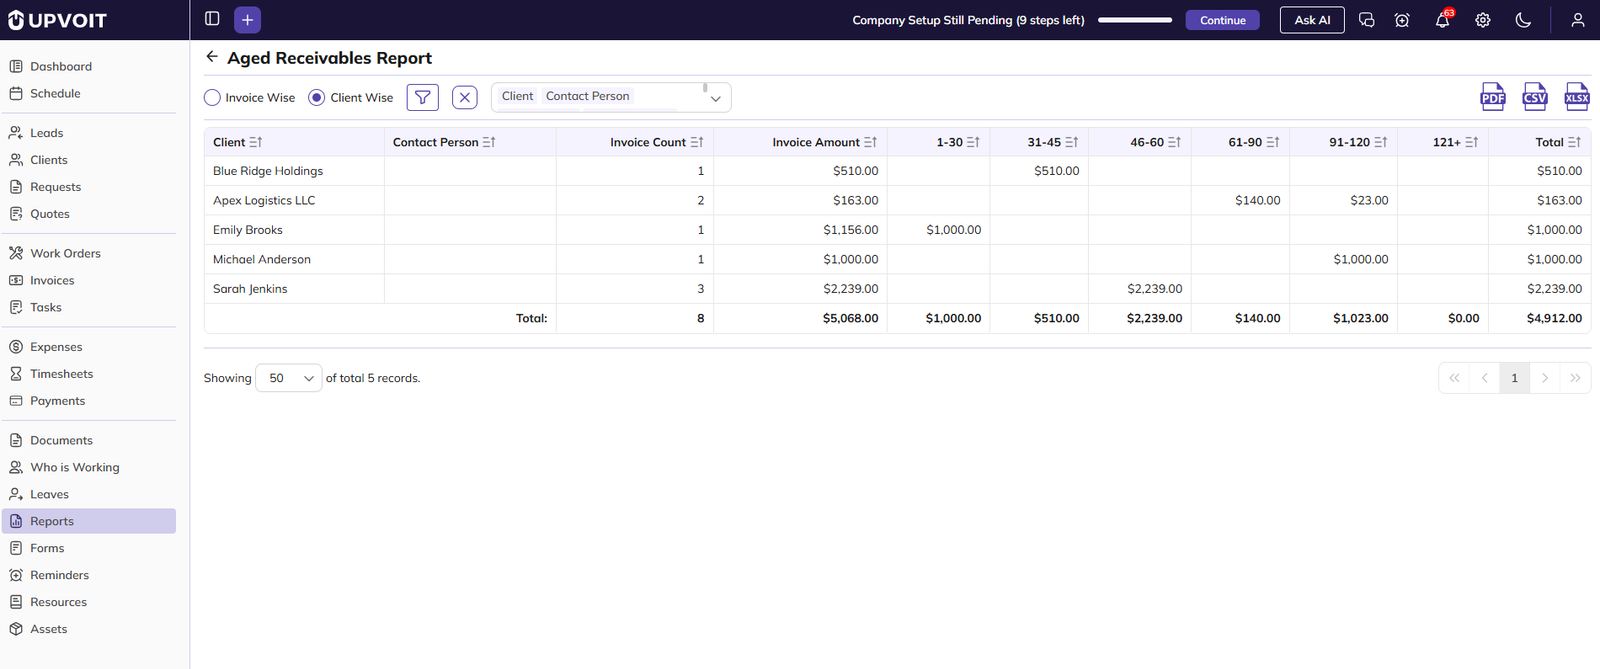
Shows unpaid invoices grouped by how many days they are overdue, so you can see which payments to follow up first. Overdue days are counted from the invoice due date.
You can view the report in two ways using the options at the top left:
-
Invoice Wise: Shows each overdue invoice on a separate row.
-
Client Wise: Shows one row per client, combining all their overdue invoices.
-
Invoice No.: Click to open the invoice. Shown in Invoice Wise view.
-
Invoice Count: The number of overdue invoices for the client. Shown in Client Wise view.
-
Invoice Amount: The total invoice value.
-
1-30, 31-45, 46-60, 61-90, 91-120, 121+: The unpaid amount, placed in the column matching the number of days the invoice is overdue.
-
Total: The client’s total unpaid amount across all overdue periods. Shown in Client Wise view.
-
Total row: The combined amounts for each column, shown at the bottom.
-
You can also use these controls on the report page:
-
Sort: Click the sort icon on a column header.
-
Export: Download the report as PDF, CSV or XLSX. Only the selected columns are exported.
-
Records per page: Show 20, 50 or 100 records per page.
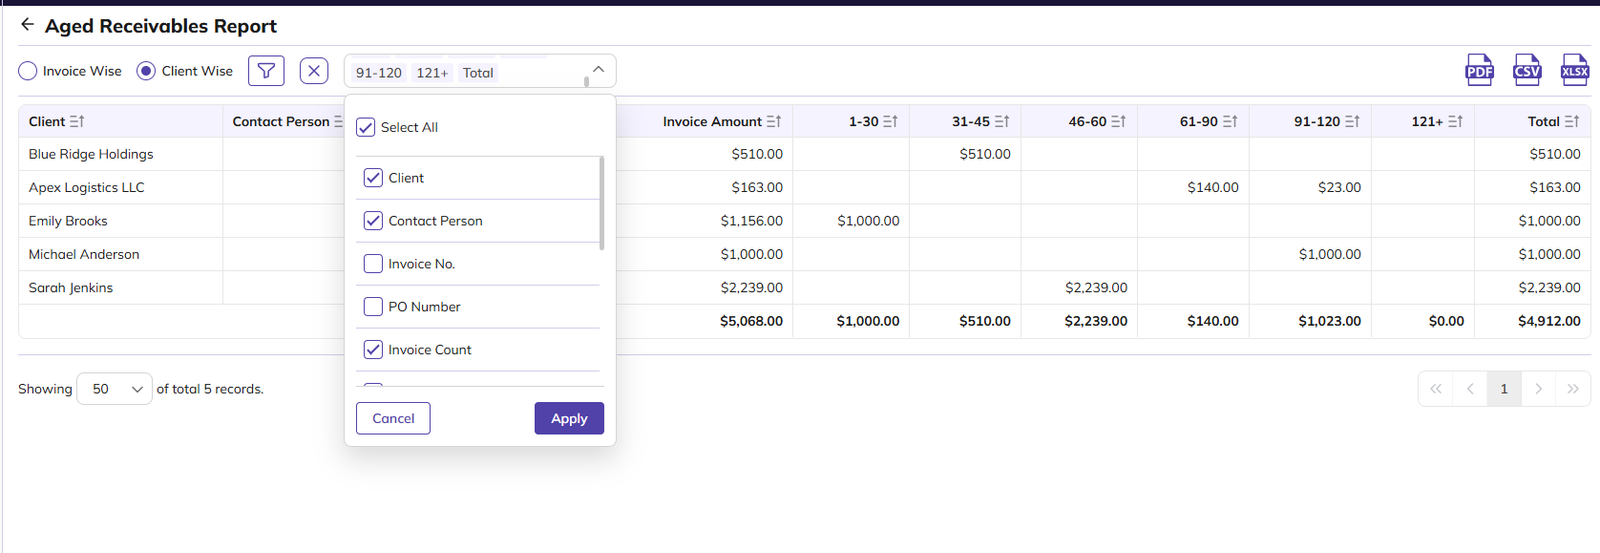
The following columns are hidden by default:
-
Invoice Wise: Total
-
Client Wise: Invoice No. and PO Number
Filtering the report:
-
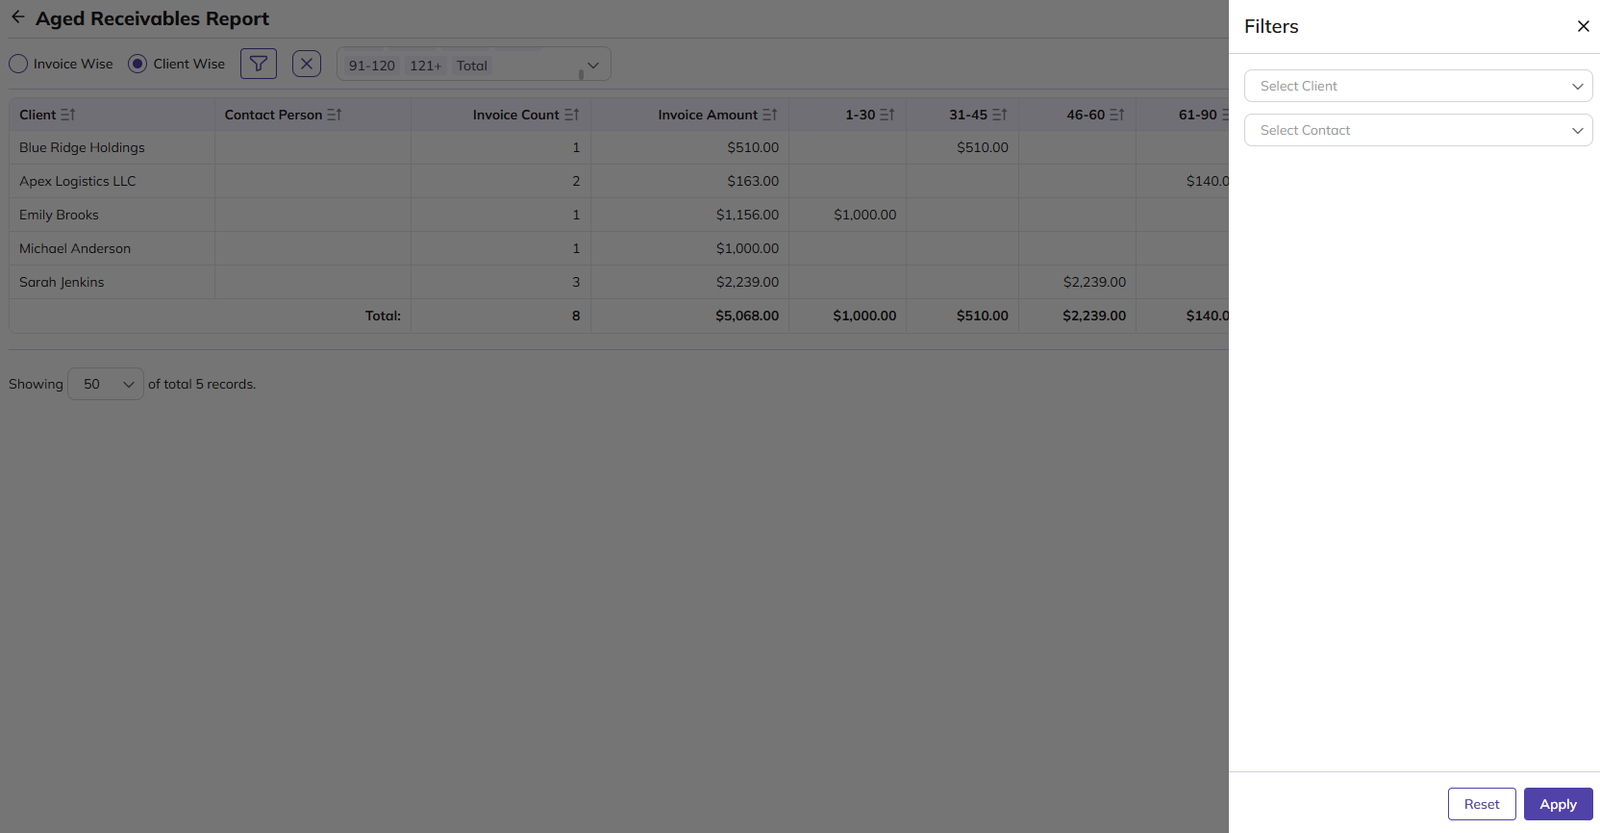
Click the Filter icon.
-
Set any of these filters:
-
Select Client
-
Select Contact
-
-
Click Apply.
-
To clear the filters, click Reset or the X icon.
Cash Flow Forecast Report
Predicts future income from unpaid invoices, grouped by how many days remain until each invoice is due. Use it to plan for expected cash inflows.
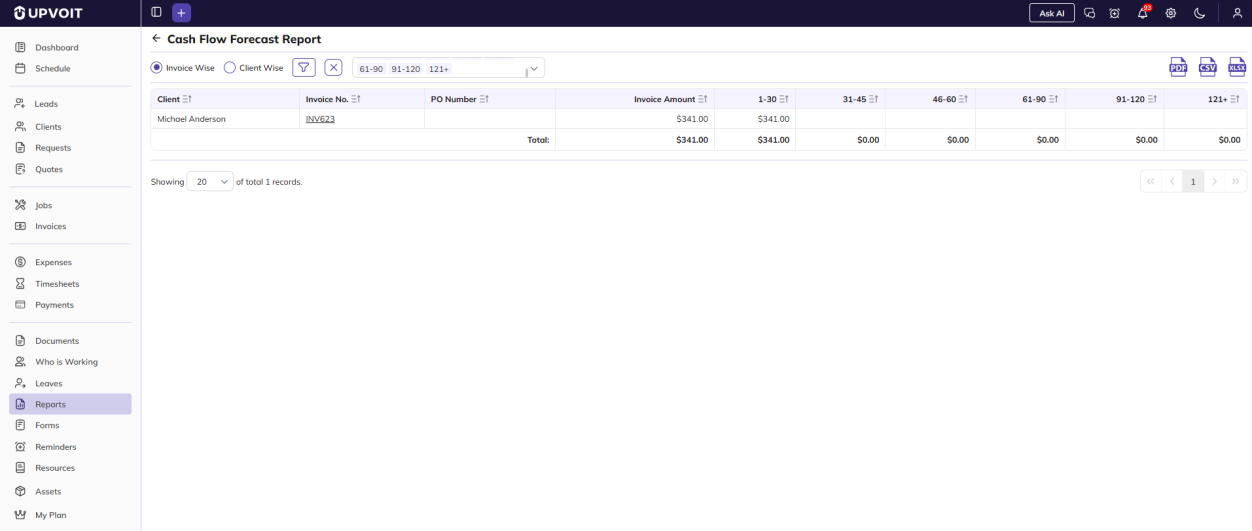
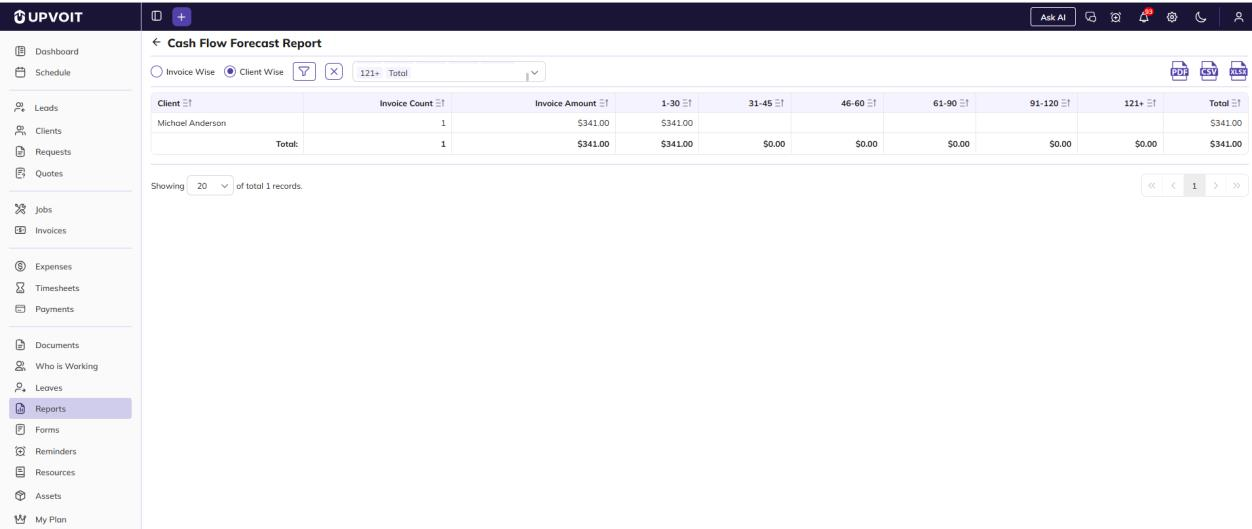
You can view the report in two ways using the options at the top left:
-
Invoice Wise: Shows each invoice on a separate row.
-
Client Wise: Shows one row per client, combining all their invoices.
-
Invoice No.: Click to open the invoice. Shown in Invoice Wise view.
-
Invoice Count: The number of invoices for the client. Shown in Client Wise view.
-
Invoice Amount: The total invoice value.
-
1-30, 31-45, 46-60, 61-90, 91-120, 121+: The expected amount, placed in the column matching the number of days until the invoice is due.
-
Total: The client’s total expected amount across all periods. Shown in Client Wise view.
-
Total row: The combined amounts for each column, shown at the bottom.
-
You can also use these controls on the report page:
-
Sort: Click the sort icon on a column header.
-
Export: Download the report as PDF, CSV or XLSX. Only the selected columns are exported.
-
Records per page: Show 20, 50 or 100 records per page.
In Client Wise view, Invoice No. and PO Number are not available.
Filtering the report:
-
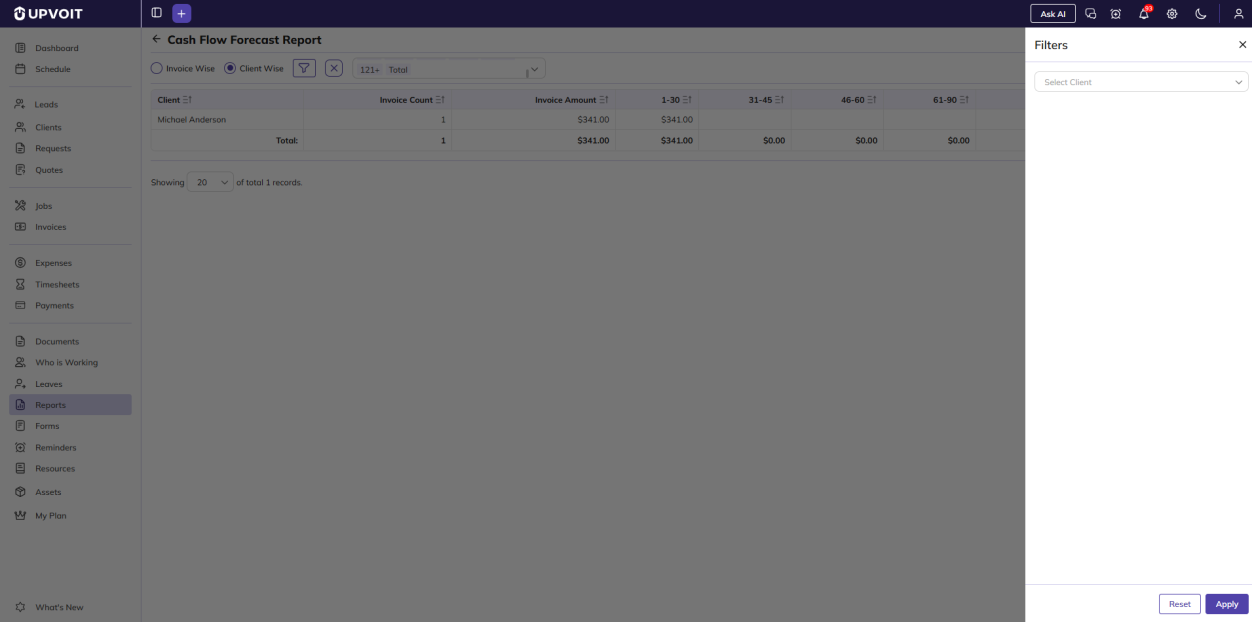
Click the Filter icon.
-
Select a client from Select Client.
-
Click Apply.
-
To clear the filter, click Reset or the X icon.
Client Statement Report
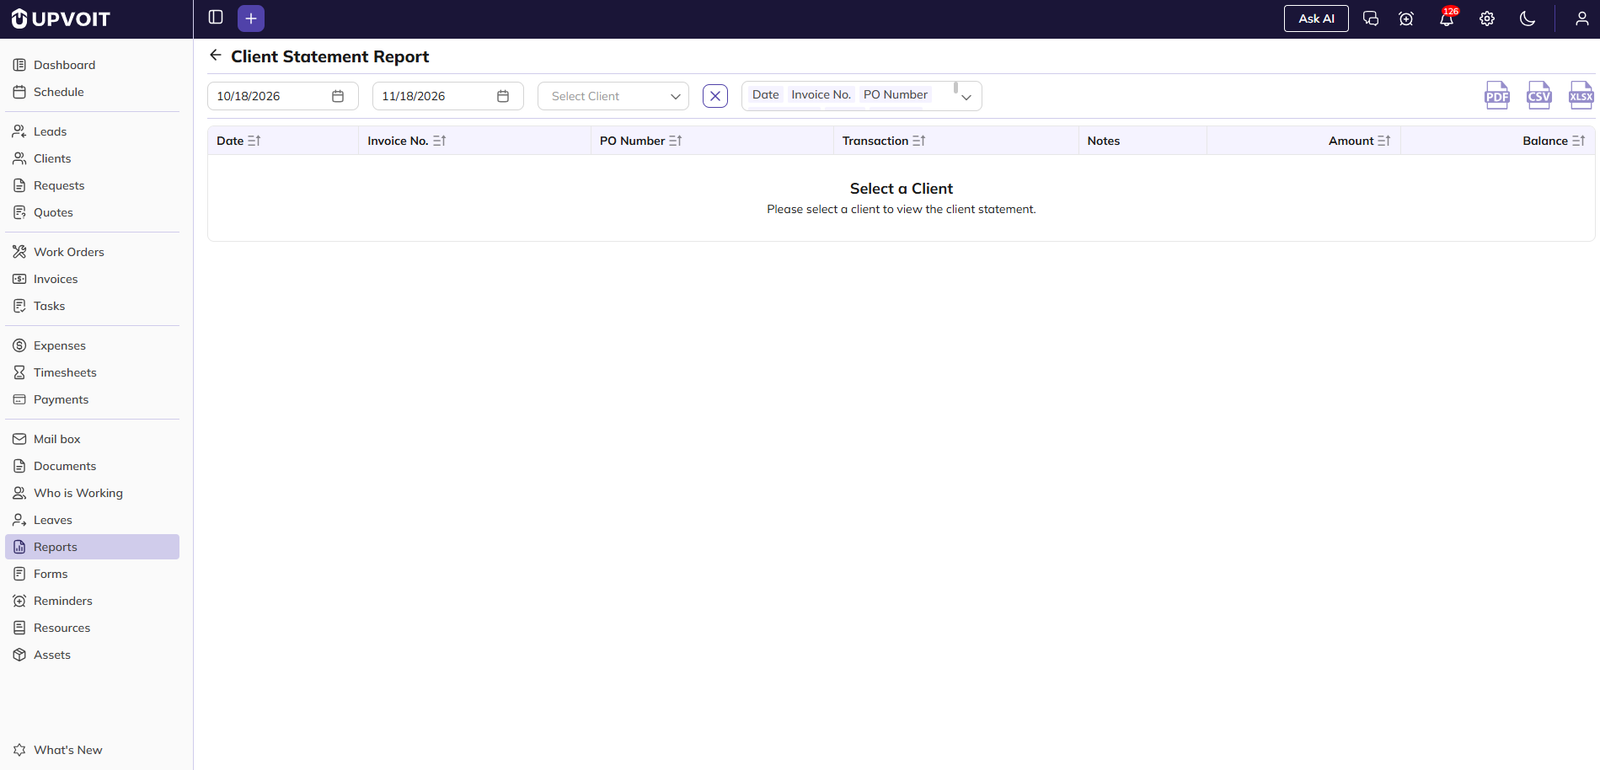
The Client Statement Report displays the account history of a selected client, including invoices and payments, along with the running balance. It helps users track transactions and monitor the client’s outstanding balance for a selected period.
Viewing a client statement:
-
Select a client from the Select Client dropdown.
-
The selected client’s statement is displayed.
-
To view transactions for a different period, change the Start Date and End Date using the date pickers at the top.
-
To clear the filter, click Reset or the X icon.
Default Date Range: The report displays the last one month up to the current date by default.
Important: The report does not display any transaction records until a client is selected. A message prompts the user to select a client.
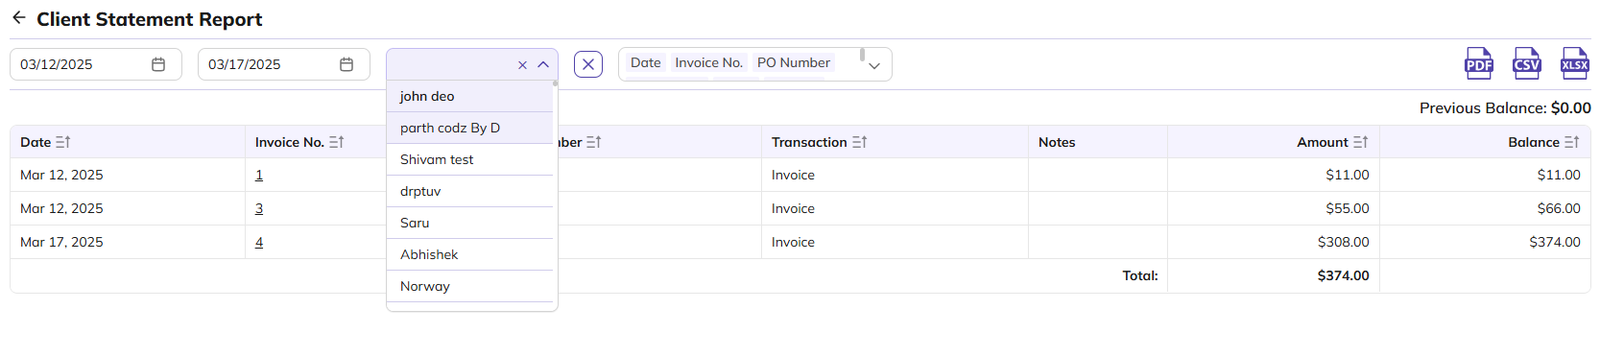
-
Previous Balance: The client’s balance before the selected start date, shown above the table.
-
Invoice No.: Click to open the invoice.
-
Transaction: Shows whether the entry is an Invoice or a Payment.
-
Notes: Additional details, such as the invoice a payment was applied to or a deposit collected against a quote.
-
Balance: The client’s running balance after each transaction. Invoices increase the balance and payments reduce it.
-
Total: The client’s closing balance for the selected period, shown at the bottom.
You can also use these controls on the report page:
-
Sort: Click the sort icon on a column header.
-
Export: Download the report as PDF, CSV or XLSX. Only the selected columns are exported.
-
Records per page: Show 20, 50 or 100 records per page.
Expenses Report
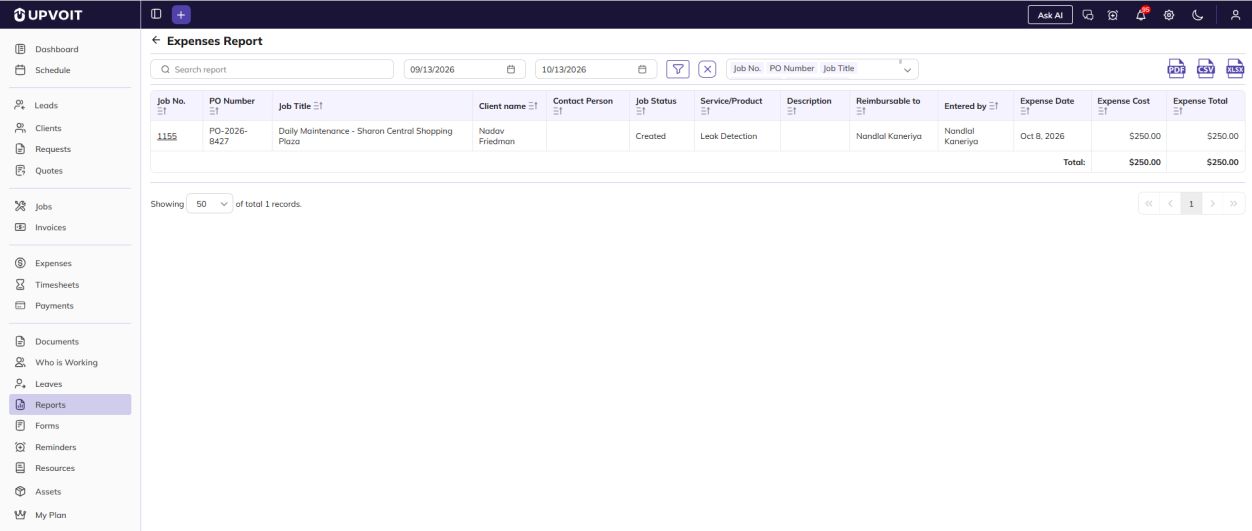
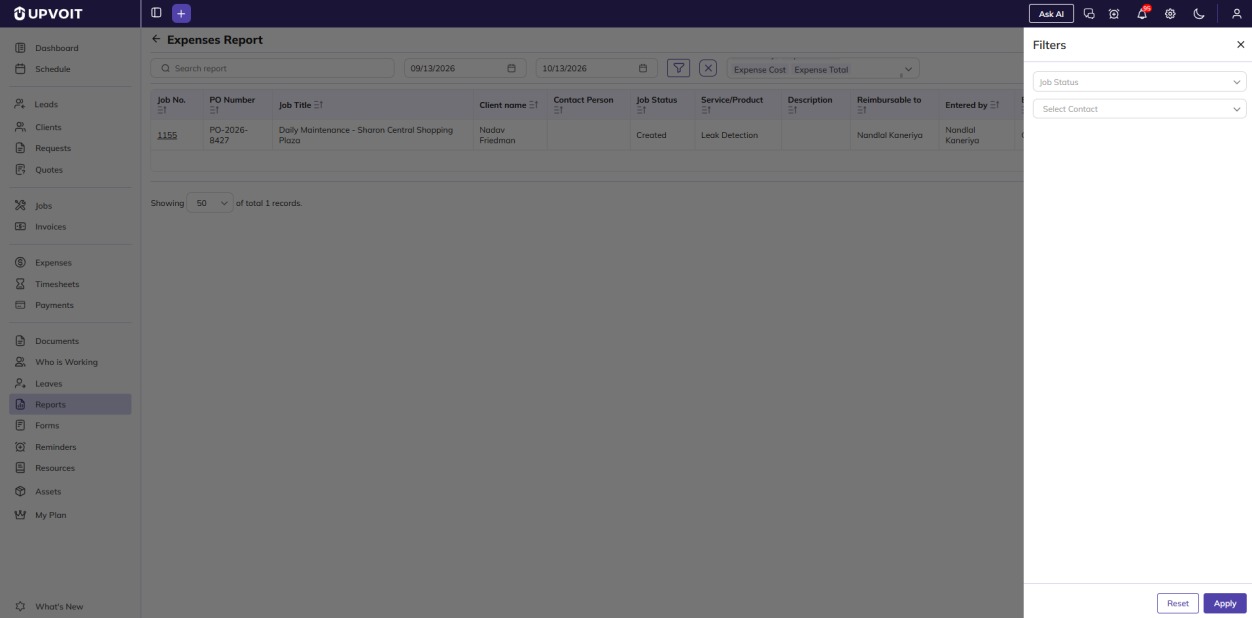
Shows all expenses recorded against jobs within a selected date range.
-
Search: Type in the search box at the top left to find matching records across all columns.
-
Date range: By default, the report shows the last one month up to today. Change the start and end dates to view a different period.
-
Job No.: Click to open the job.
-
Service/Product: The service or product the expense relates to.
-
Reimbursable to: The team member to be repaid for the expense.
-
Entered by: The team member who recorded the expense.
-
Expense Cost: The actual cost of the expense, paid to the team member it is reimbursable to.
-
Expense Total: The amount charged to the client for the expense.
-
Total: The combined Expense Cost and Expense Total of all listed expenses, shown at the bottom.
You can also use these controls on the report page:
-
Sort: Click the sort icon on a column header.
-
Export: Download the report as PDF, CSV or XLSX. Only the selected columns are exported.
-
Records per page: Show 20, 50 or 100 records per page.
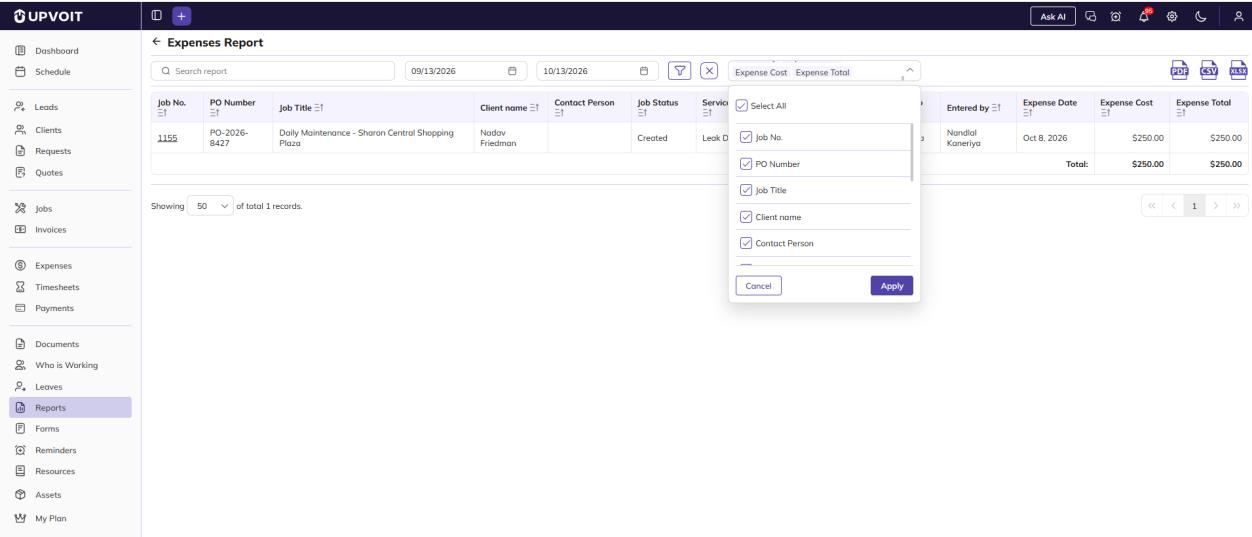
Filtering the report:
-
Click the Filter icon.
-
Set any of these filters:
-
Job Status: The job statuses set up under Settings > Work Order Status.
-
Select Contact
-
-
Click Apply.
-
To clear the filters, click Reset or the X icon.
Profit & Loss Report
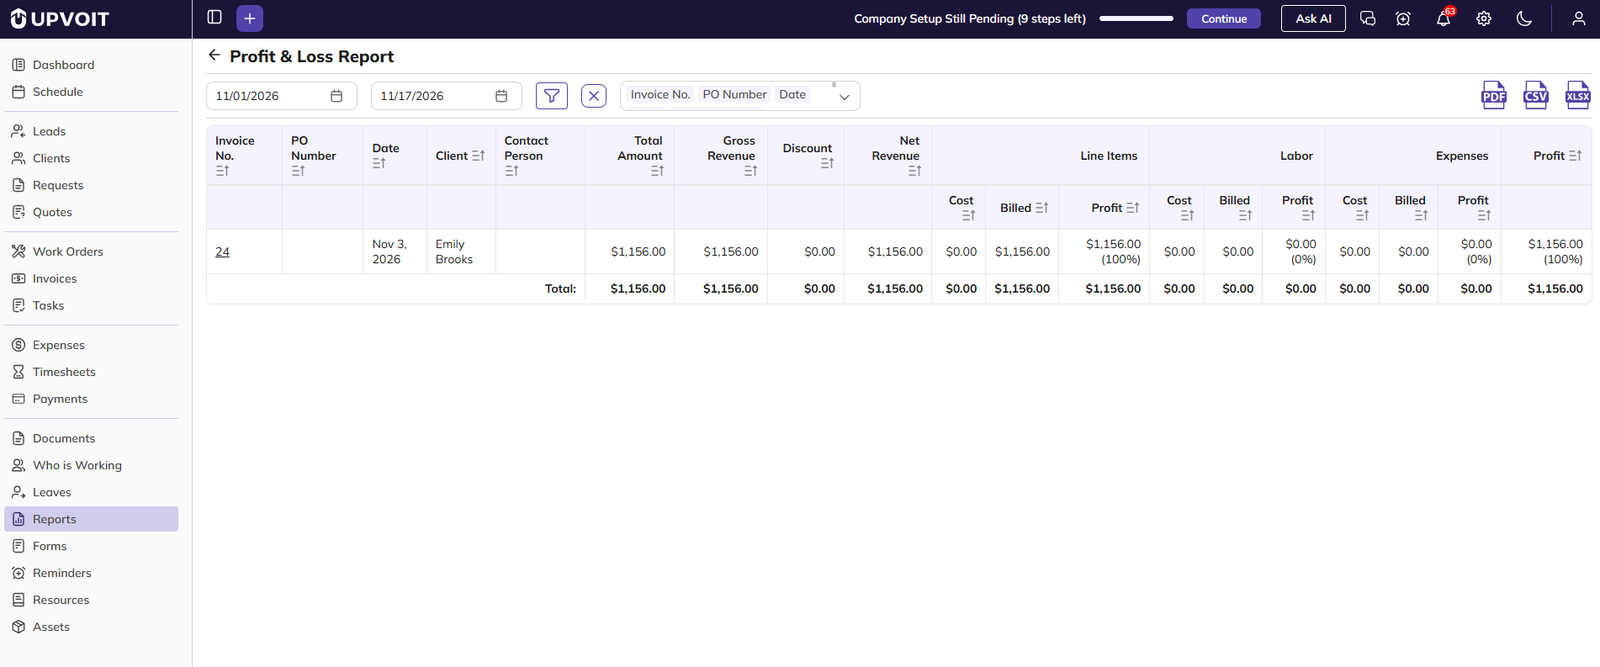
Shows the profit or loss earned on each invoice within a selected date range. Profit is broken down by line items, labor and expenses, so you can see where money is being made or lost.
-
Date range: By default, the report shows the current month up to today. Change the start and end dates to view a different period.
-
Invoice No.: Click to open the invoice.
-
Total Amount: The invoice total, including tax.
-
Gross Revenue: The invoice amount before tax and discount.
-
Discount: The discount given on the invoice.
-
Net Revenue: Gross Revenue minus Discount.
-
Line Items / Labor / Expenses: Each section shows three values:
-
Cost: What it cost the business.
-
Billed: What was charged to the client.
-
Profit: Billed minus Cost, with the profit percentage shown in brackets. A negative value means a loss.
-
-
Profit: The total profit on the invoice, adding up the Line Items, Labor and Expenses profit. The percentage is calculated on Net Revenue.
-
Total: The combined values of all listed invoices, shown at the bottom.
You can also use these controls on the report page:
-
Sort: Click the sort icon on a column header.
-
Export: Download the report as PDF, CSV or XLSX. Only the selected columns are exported.
-
Records per page: Show 20, 50 or 100 records per page.
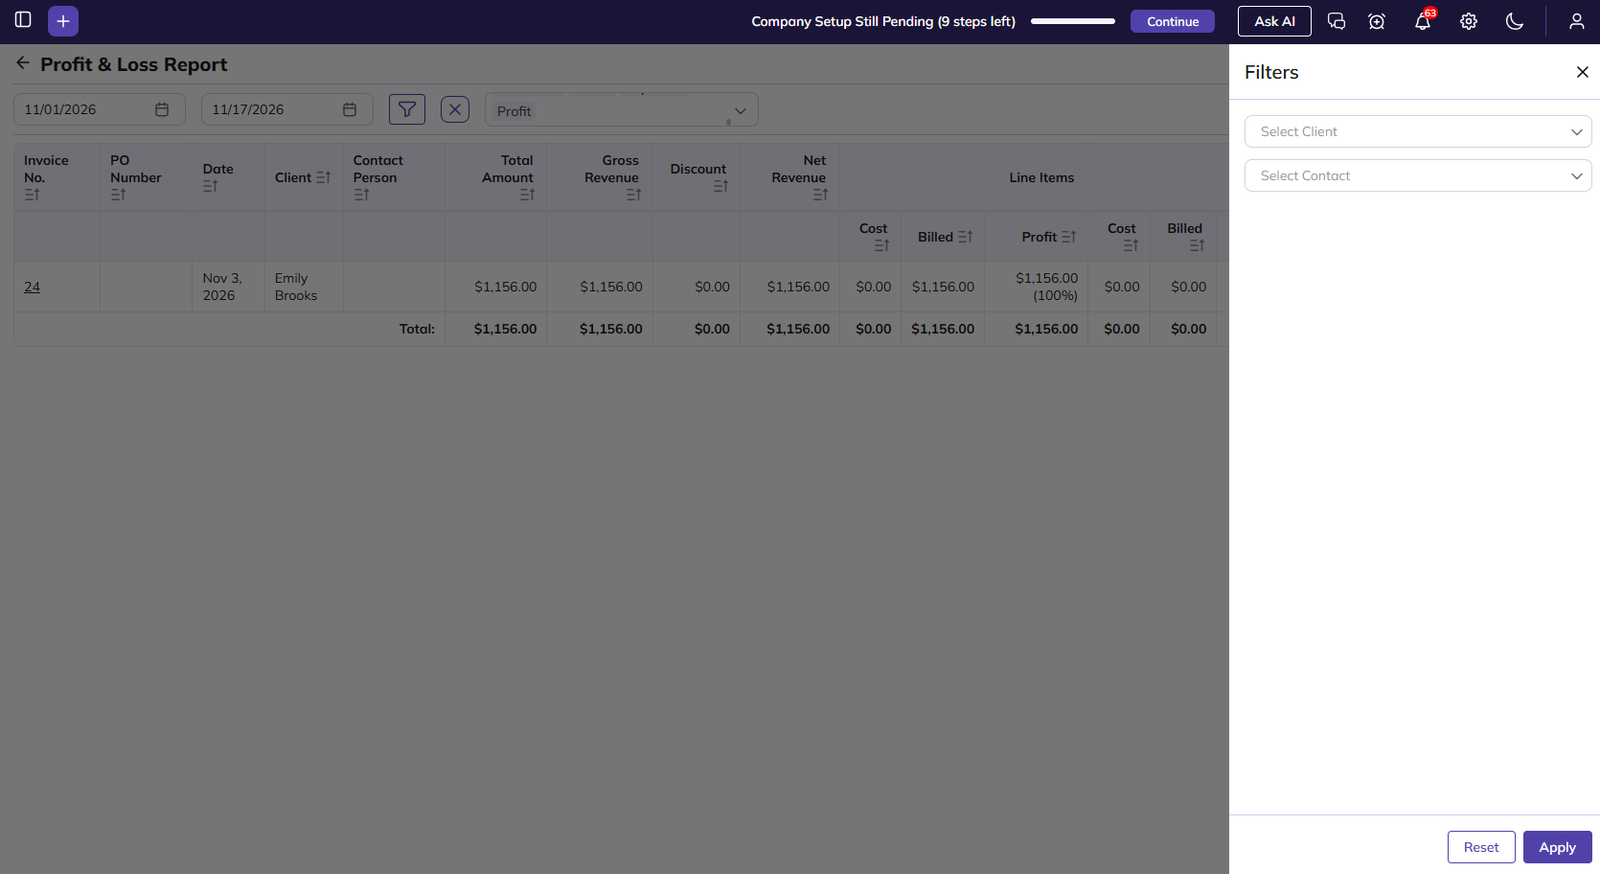
Filtering the report:
-
Click the Filter icon.
-
Set any of these filters:
-
Select Client
-
Select Contact
-
-
Click Apply.
-
To clear the filters, click Reset or the X icon.
Payroll Report
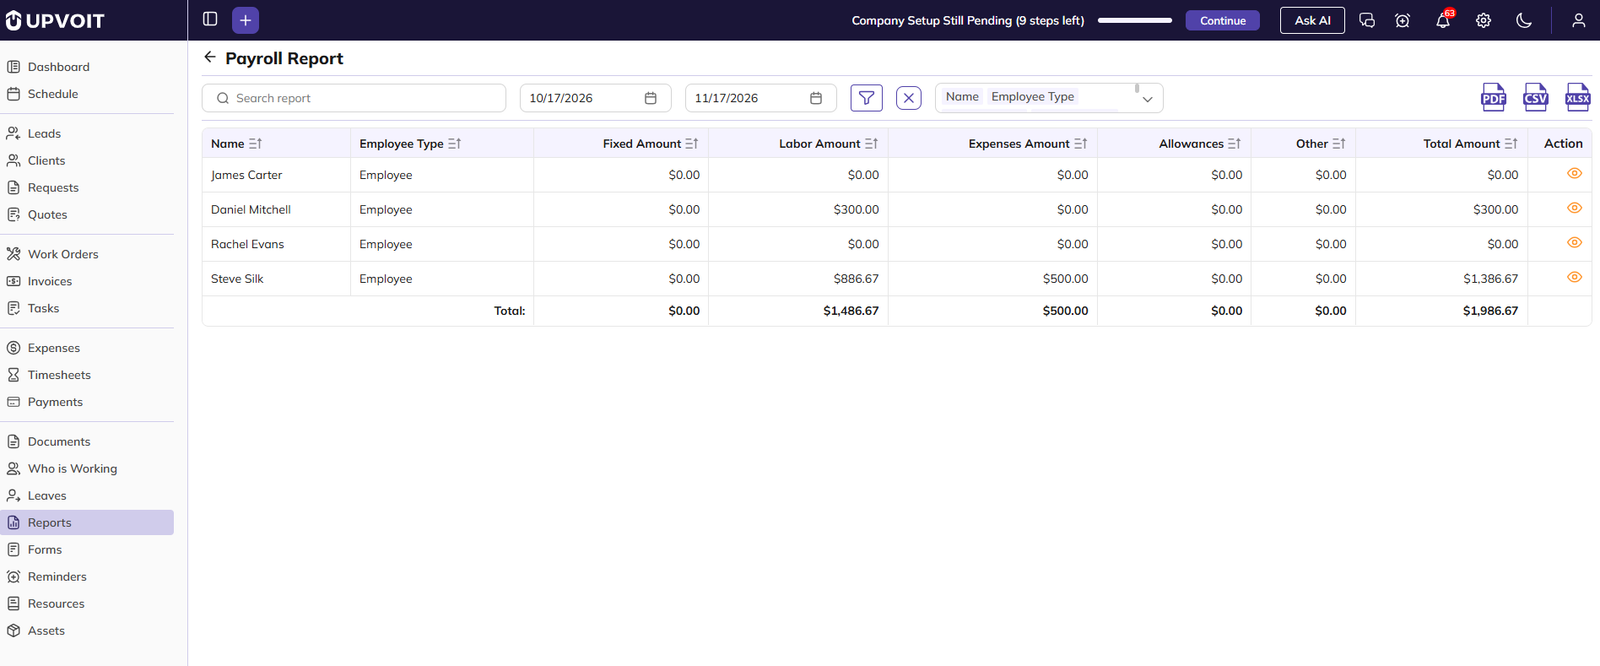
Shows the amount payable to each team member within a selected date range, broken down by pay type.
-
Search: Type in the search box at the top left to find matching records.
-
Date range: By default, the report shows the last one month up to today. Change the start and end dates to view a different period.
-
Employee Type: Shows whether the team member is an Employee or a Sub Contractor.
-
Fixed Amount: The fixed pay for the team member, shown in the Payroll Details.
-
Labor Amount: The pay for time worked on jobs.
-
Expenses Amount: The expenses to be reimbursed to the team member.
-
Allowances: The allowances given to the team member.
-
Other: Additional earnings or deductions, shown under Earnings/Deductions in the Payroll Details.
-
Total Amount: The total payable, adding up all the amounts above.
-
Action: Click the View (eye) icon to see the payroll details for that team member.
-
Total: The combined amounts of all listed team members, shown at the bottom.
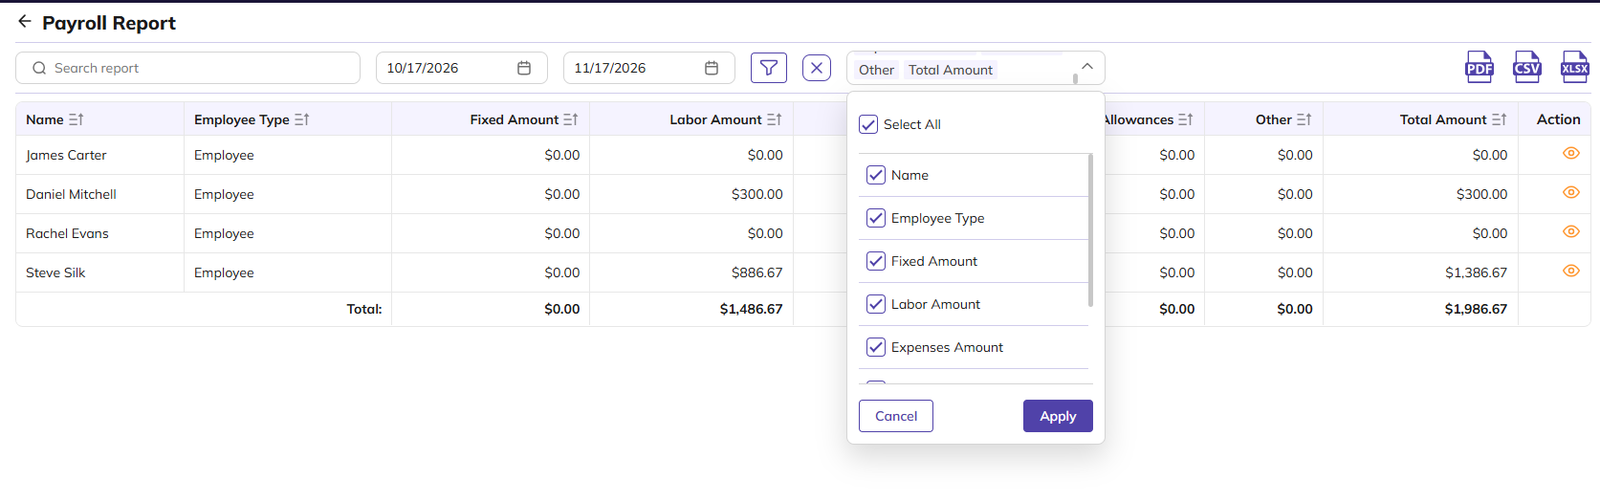
You can also use these controls on the report page:
-
Sort: Click the sort icon on a column header.
-
Export: Download the report as PDF, CSV or XLSX. Only the selected columns are exported.
-
Records per page: Show 20, 50 or 100 records per page.
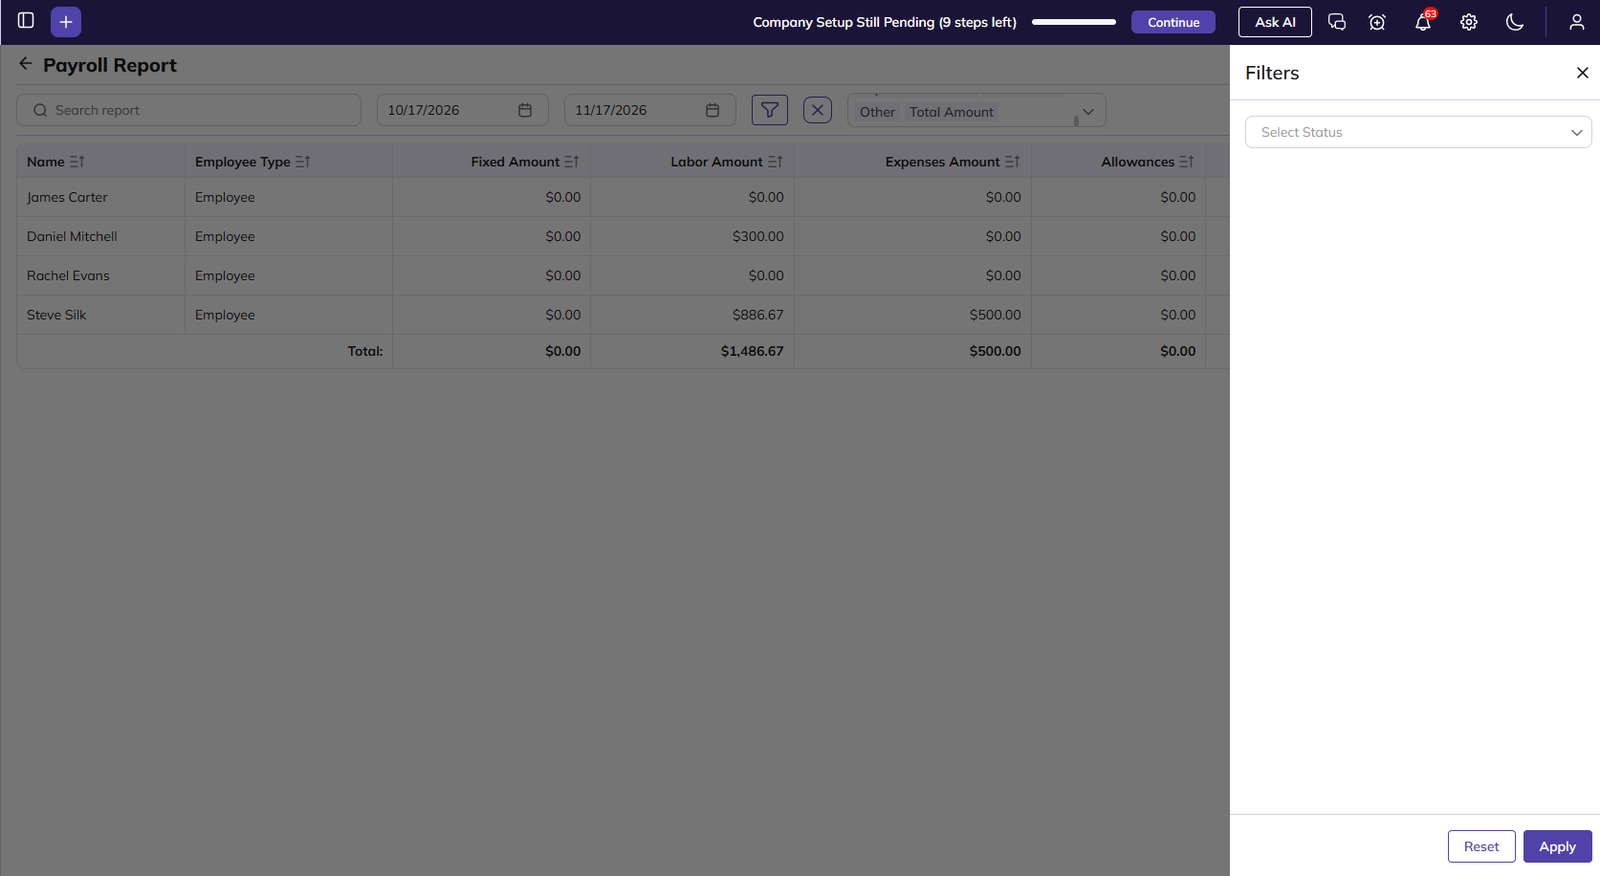
Filtering the report:
-
Click the Filter icon.
-
Select a Status, either Paid or Unpaid.
-
Click Apply.
-
To clear the filter, click Reset or the X icon.
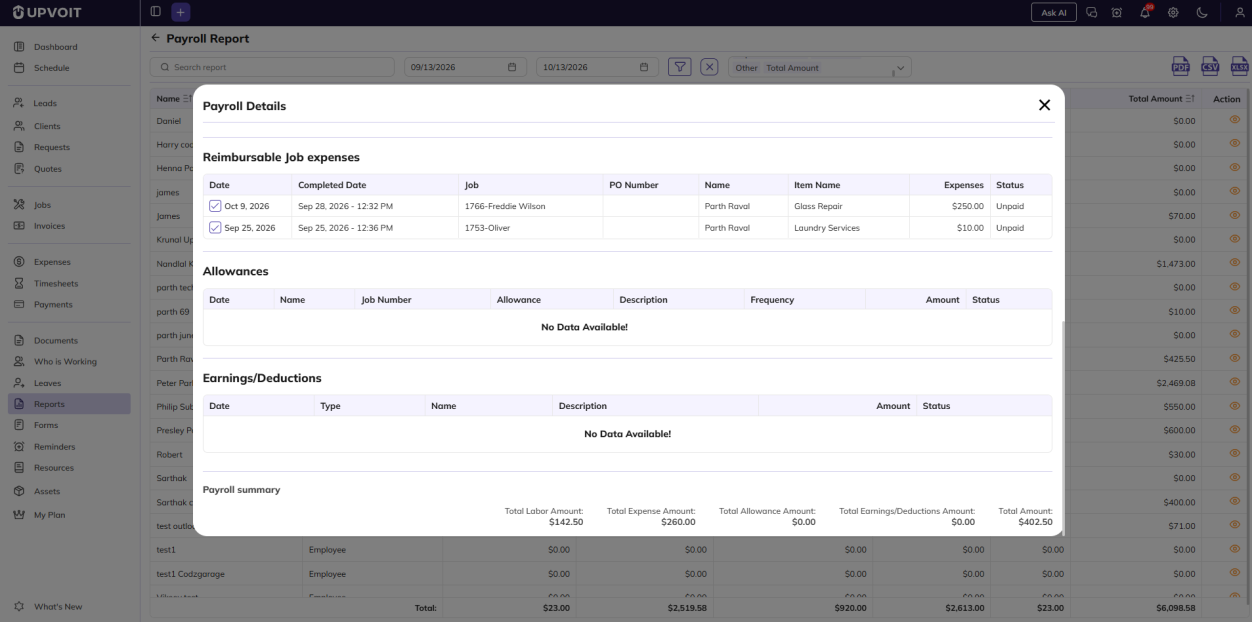
Payroll Details
Click the View (eye) icon next to a team member to open their payroll details for the selected period. You can download the details as PDF, CSV or XLSX using the icons at the top right.
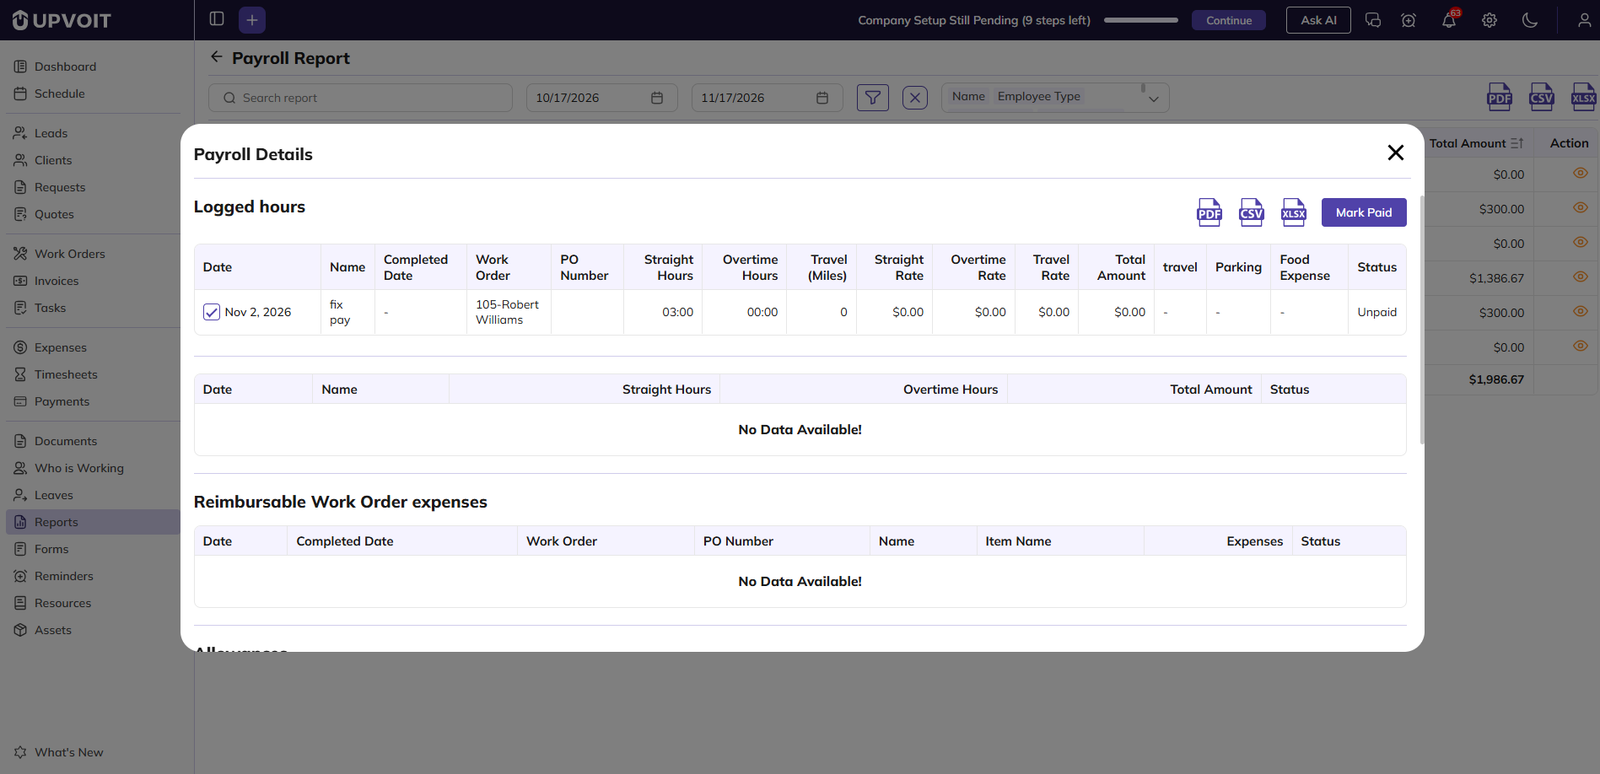
The details are grouped into these sections:
-
Logged hours: Shows two tables.
-
The first lists time logged on jobs, with straight hours, overtime hours and travel miles, and their rates. Total Amount is calculated as hours × rate, plus miles × travel rate.
-
The second lists logged hours that are still unpaid. If all hours have been paid, this table is empty.
-
-
Reimbursable Job expenses: Job expenses to be repaid to the team member.
-
Allowances: Allowances given to the team member, with their frequency, such as Per Job.
-
Earnings/Deductions: Additional earnings or deductions applied to the team member’s pay.
-
Payroll summary: The totals for labor, expenses, allowances and earnings/deductions, and the overall Total Amount.
Each entry shows a Status of Paid or Unpaid. To pay entries, go to Timesheets, select the entries you want to pay, and click Mark As Paid.
Work Reports
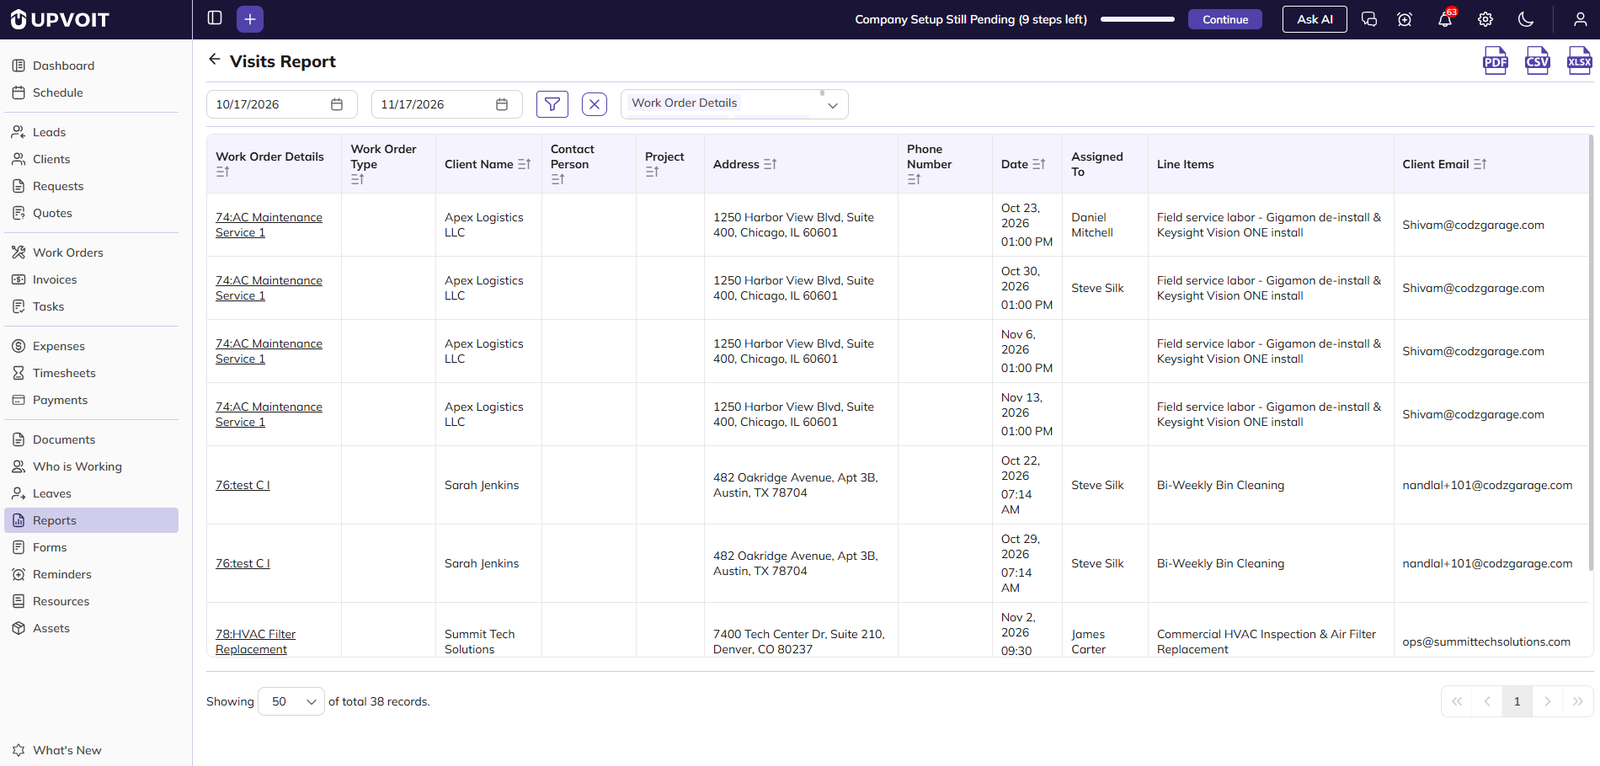
Visits Report
Shows past and upcoming visits within a selected date range, with their job, client and assignment details.
-
Date range: By default, the report shows the last one month up to today. To see upcoming visits, set the end date to a future date.
-
Job Details: The job number and title. Click to open the job.
-
Project: The project the job belongs to.
-
Date: The date and time of the visit.
-
Assigned To: The team members assigned to the visit.
-
Line Items: The services or products on the visit.
You can also use these controls on the report page:
-
Sort: Click the sort icon on a column header.
-
Export: Download the report as PDF, CSV or XLSX. Only the selected columns are exported.
-
Records per page: Show 20, 50 or 100 records per page.
Filtering the report:
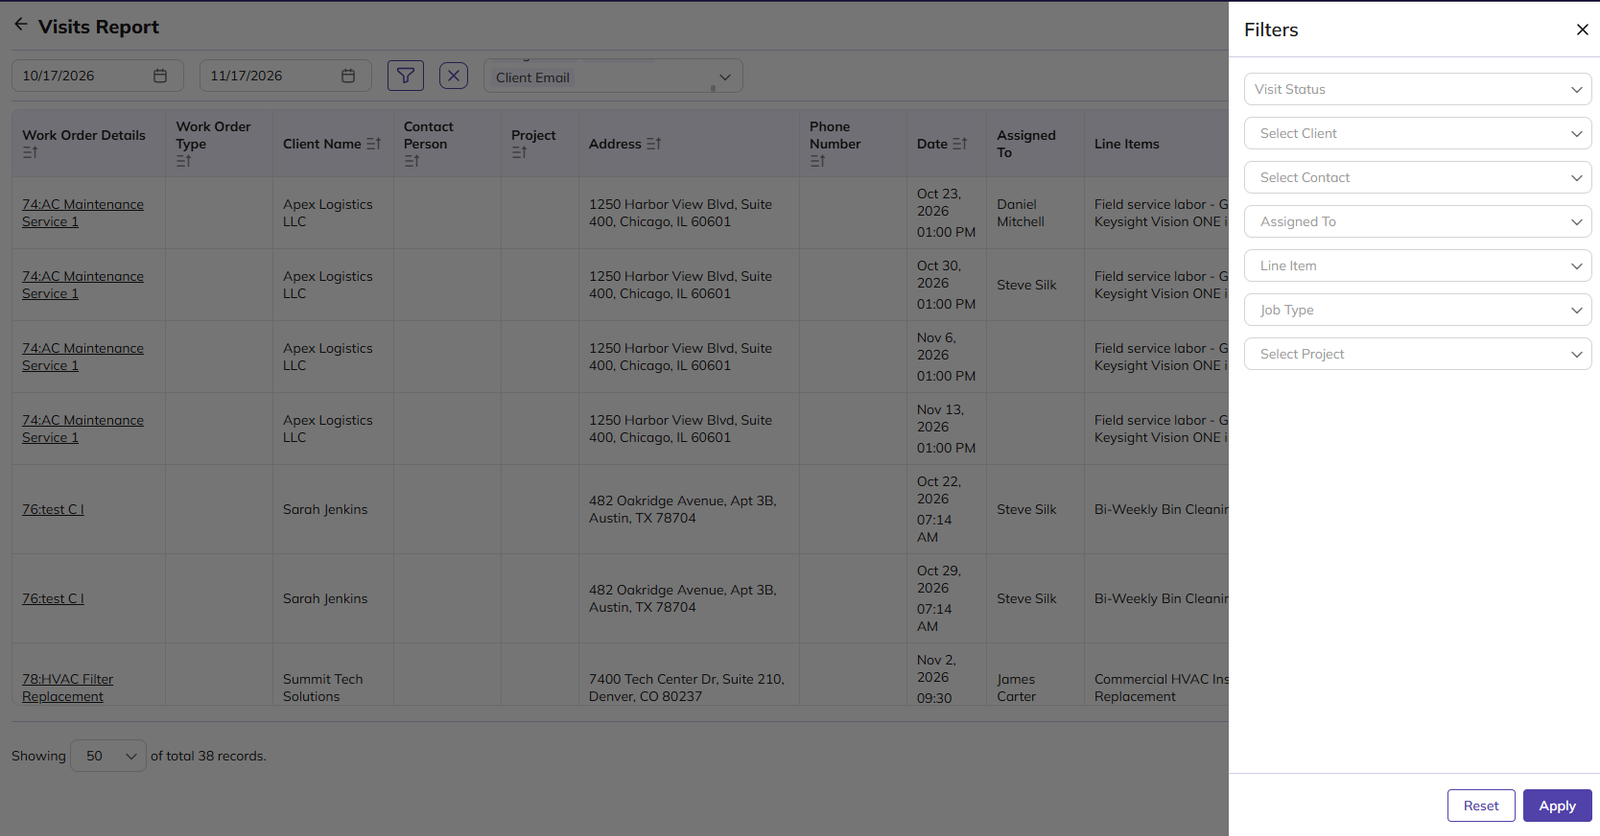
-
Click the Filter icon.
-
Set any of these filters:
-
Visit Status: Completed, In Complete, In Review, Invoiced, Partially Paid or Paid.
-
Select Client
-
Select Contact
-
Assigned To: Show visits assigned to a specific team member.
-
Line Item: Show visits that include a specific service or product.
-
Job Type: The job types set up under Settings > Job Type.
-
Select Project
-
-
Click Apply.
-
To clear the filters, click Reset or the X icon.
One Off Work Order Report
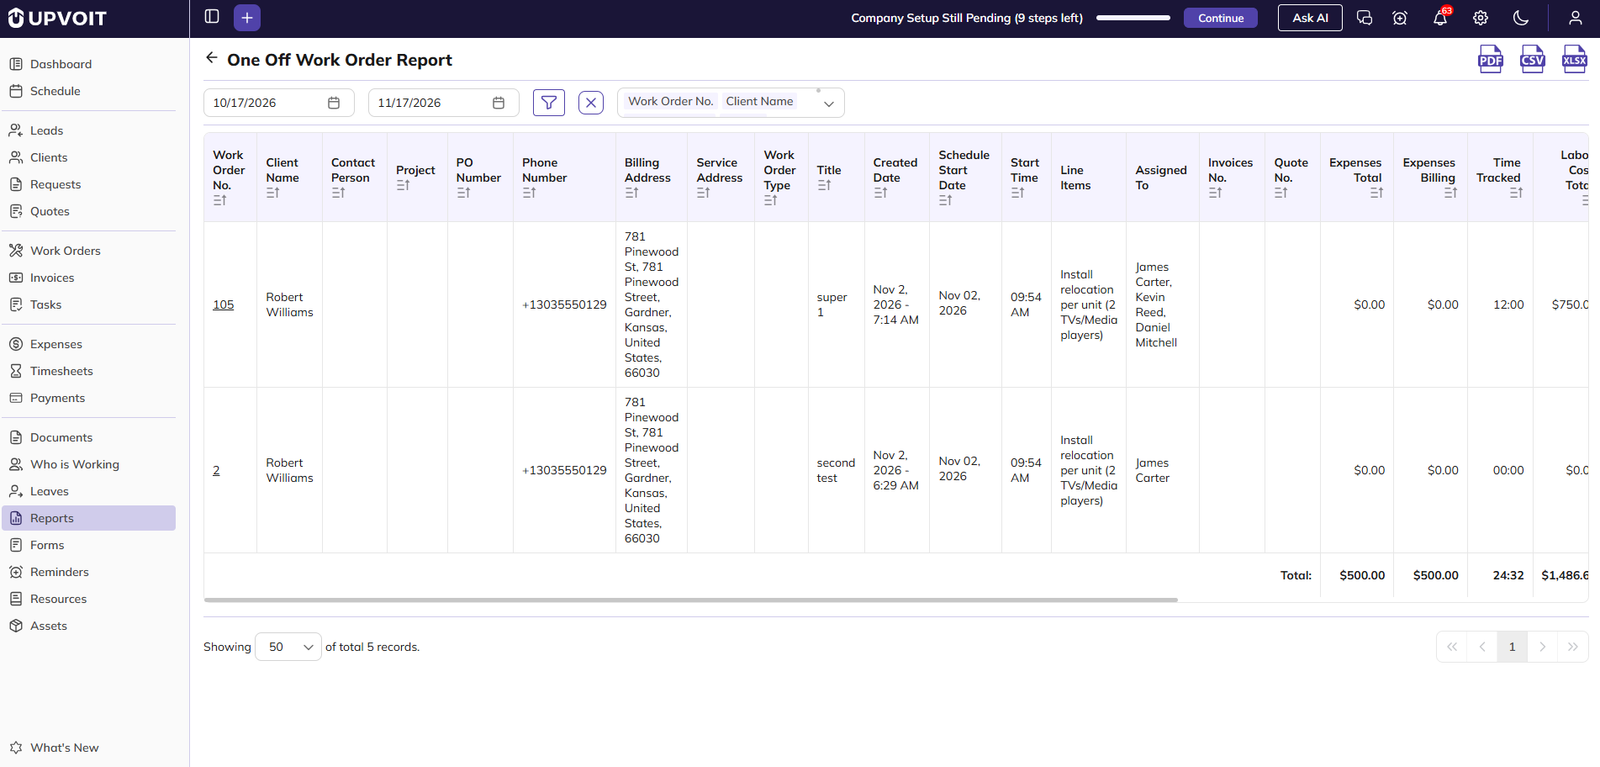
Shows one-off Work Orders within a selected date range, with their client details, schedule, costs, billing and profit.
-
Date range: Filters Work Orders by Schedule Start Date. By default, the report shows the last one month up to today. Change the start and end dates to view a different period.
-
Work Order No.: Click to open the Work Order.
-
Schedule Start Date / Start Time: When the Work Order is scheduled to start.
-
Invoices No. / Quote No.: The invoice and quote linked to the Work Order.
-
Time Tracked: The total time logged on the Work Order by the team.
-
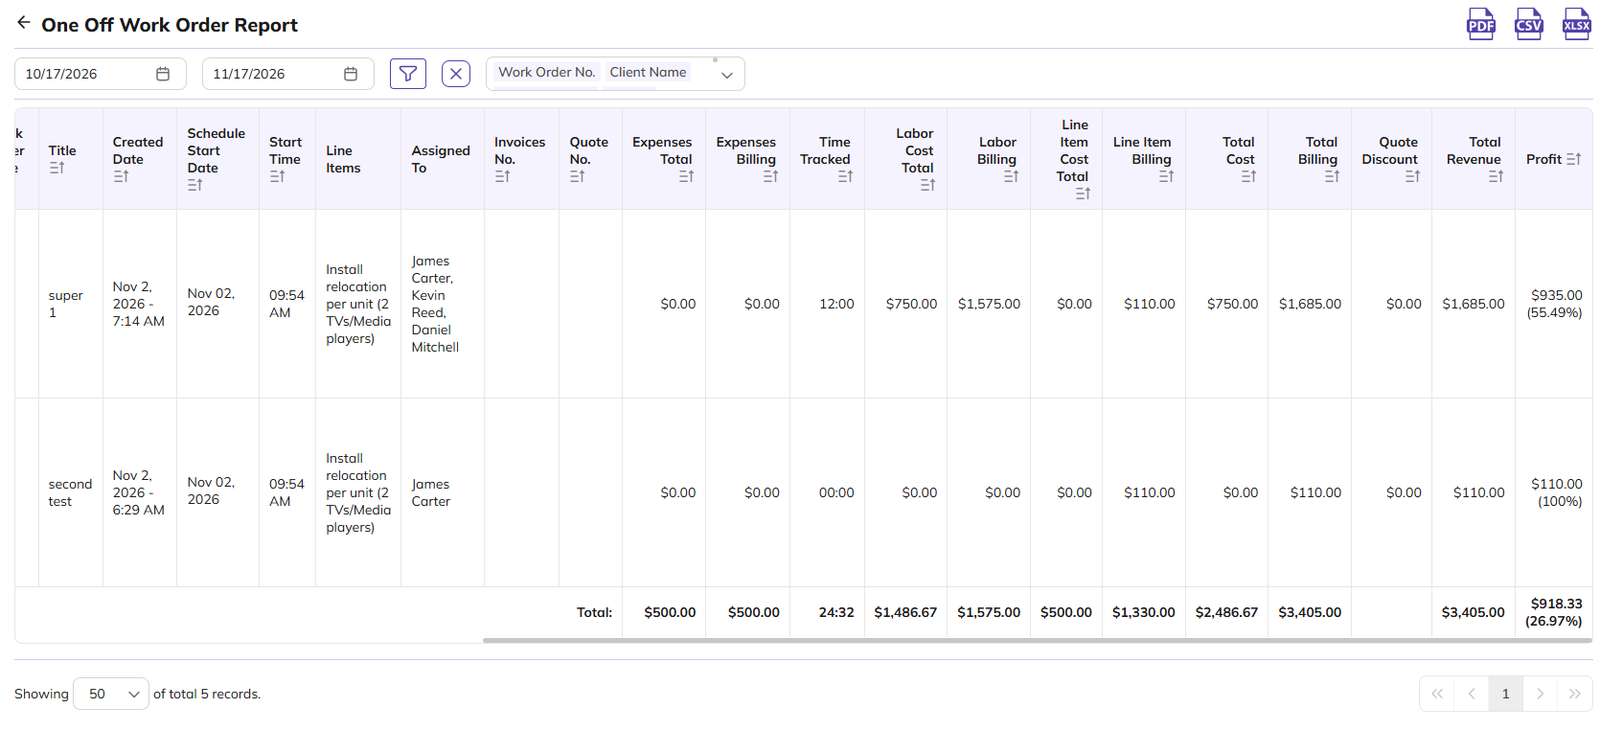
Expenses, Labor and Line Item columns: Each shows the cost to the business and the amount billed to the client.
-
Total Cost / Total Billing: The combined cost and billing for expenses, labor and line items.
-
Quote Discount: The discount given on the linked quote.
-
Total Revenue: The revenue from the Work Order’s line items, including tax.
-
Profit: Total Revenue minus Total Cost, with the profit percentage in brackets. A negative value means a loss.
-
Total: The combined values of all listed Work Orders, shown at the bottom.
The table is wide, so scroll right to see all columns.
You can also use these controls on the report page:
-
Sort: Click the sort icon on a column header.
-
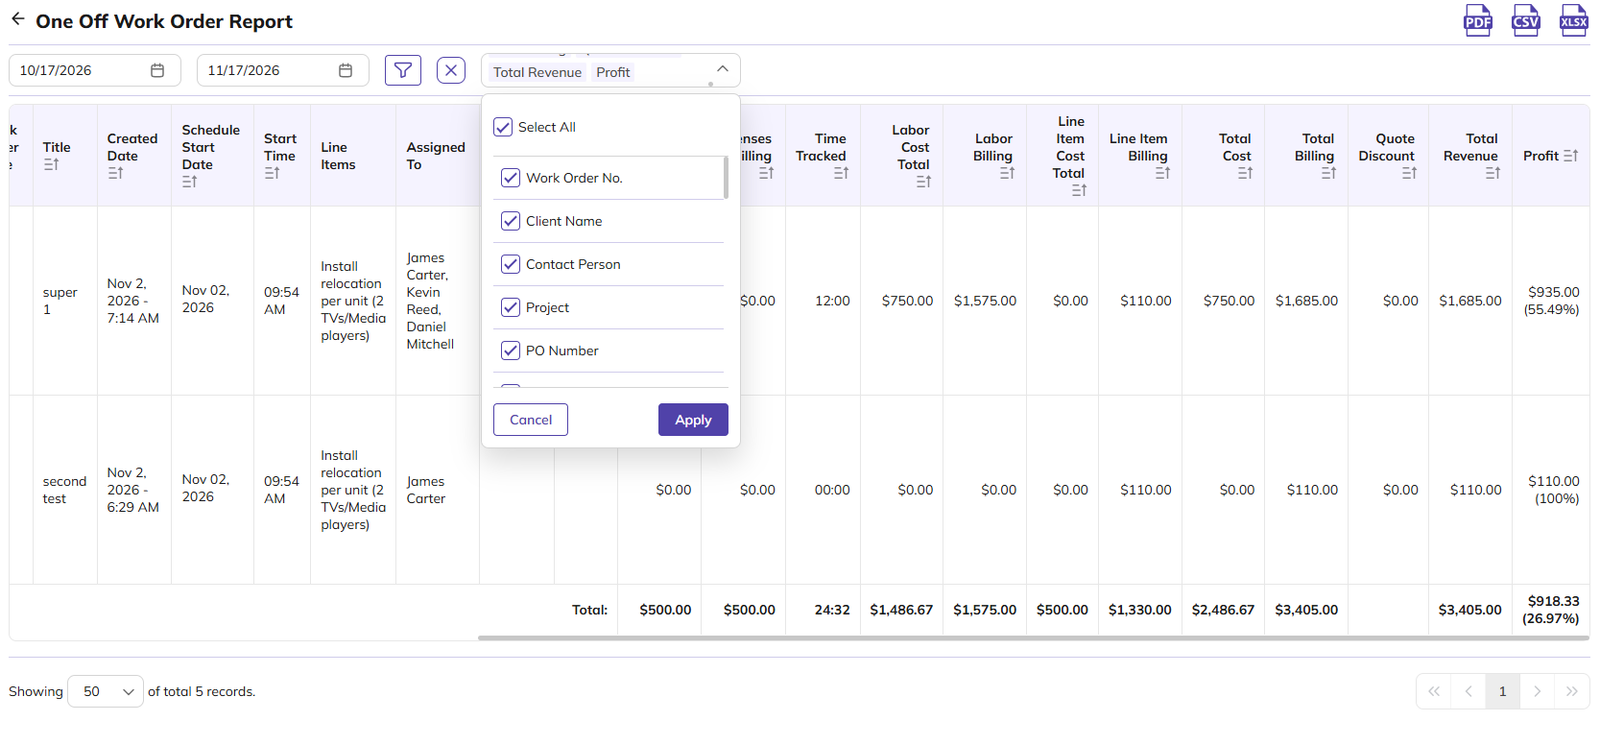
Export: Download the report as PDF, CSV or XLSX. Only the selected columns are exported.
-
Records per page: Show 20, 50 or 100 records per page.
Filtering the report:
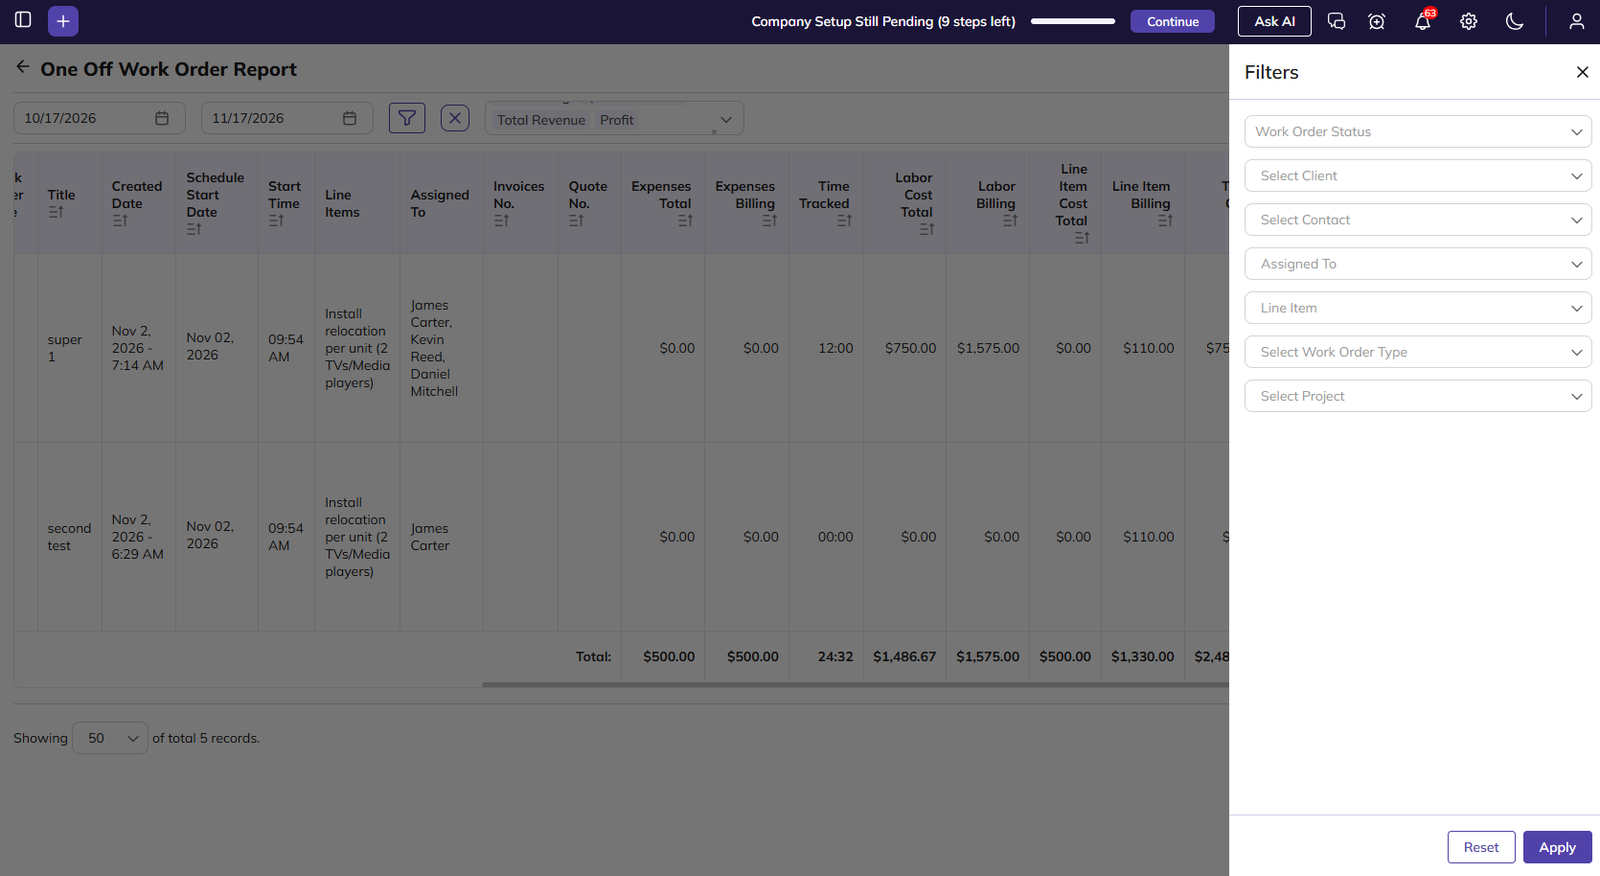
-
Click the Filter icon.
-
Set any of these filters:
-
Work Order Status: The Work Order statuses set up under Settings > Work Order Status.
-
Select Client
-
Select Contact
-
Assigned To: Show Work Orders assigned to a specific team member.
-
Line Item: Show Work Orders that include a specific service or product.
-
Select Work Order Type: The Work Order types set up under Settings > Job Type.
-
Select Project
-
-
Click Apply.
-
To clear the filters, click Reset or the X icon.
Recurring Work Order Report
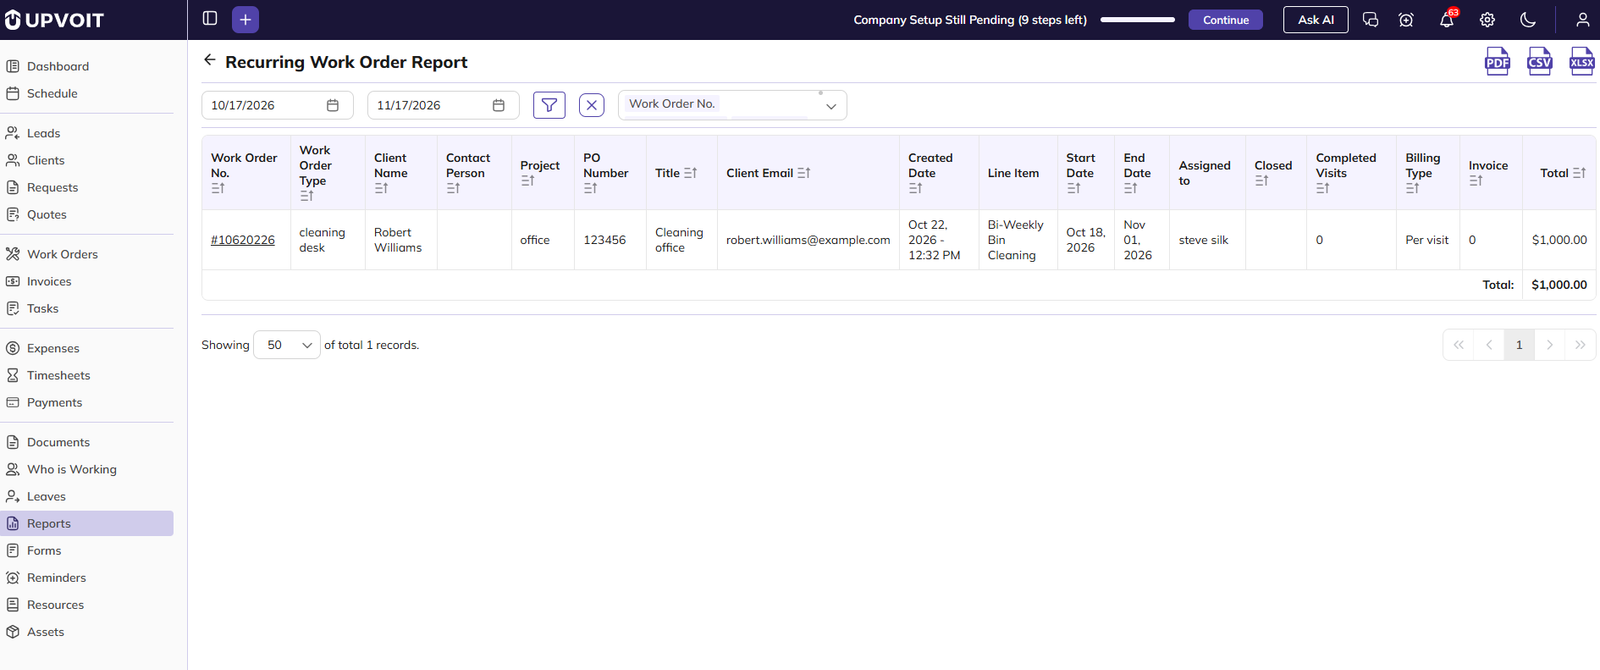
Shows recurring Work Orders within a selected date range, with their schedule, visits, billing and invoice details.
-
Date range: Filters Work Orders by Start Date. By default, the report shows the last one month up to today. Change the start and end dates to view a different period.
-
Work Order No.: Click to open the Work Order.
-
Start Date / End Date: The period over which the Work Order recurs.
-
Closed: The date the Work Order was closed, if it has been closed.
-
Completed Visits: The number of visits completed so far.
-
Billing Type: How the client is billed for the Work Order, either Per Visit or Fixed Price. This is set on the Work Order under How do you want to invoice?
-
Invoice: The number of invoices raised for the Work Order.
-
Total: The balance due on the Work Order, as shown in the Work Order’s Payment Details.
-
Total row: The combined Total of all listed Work Orders, shown at the bottom.
You can also use these controls on the report page:
-
Sort: Click the sort icon on a column header.
-
Export: Download the report as PDF, CSV or XLSX. Only the selected columns are exported.
-
Records per page: Show 20, 50 or 100 records per page.
Filtering the report:
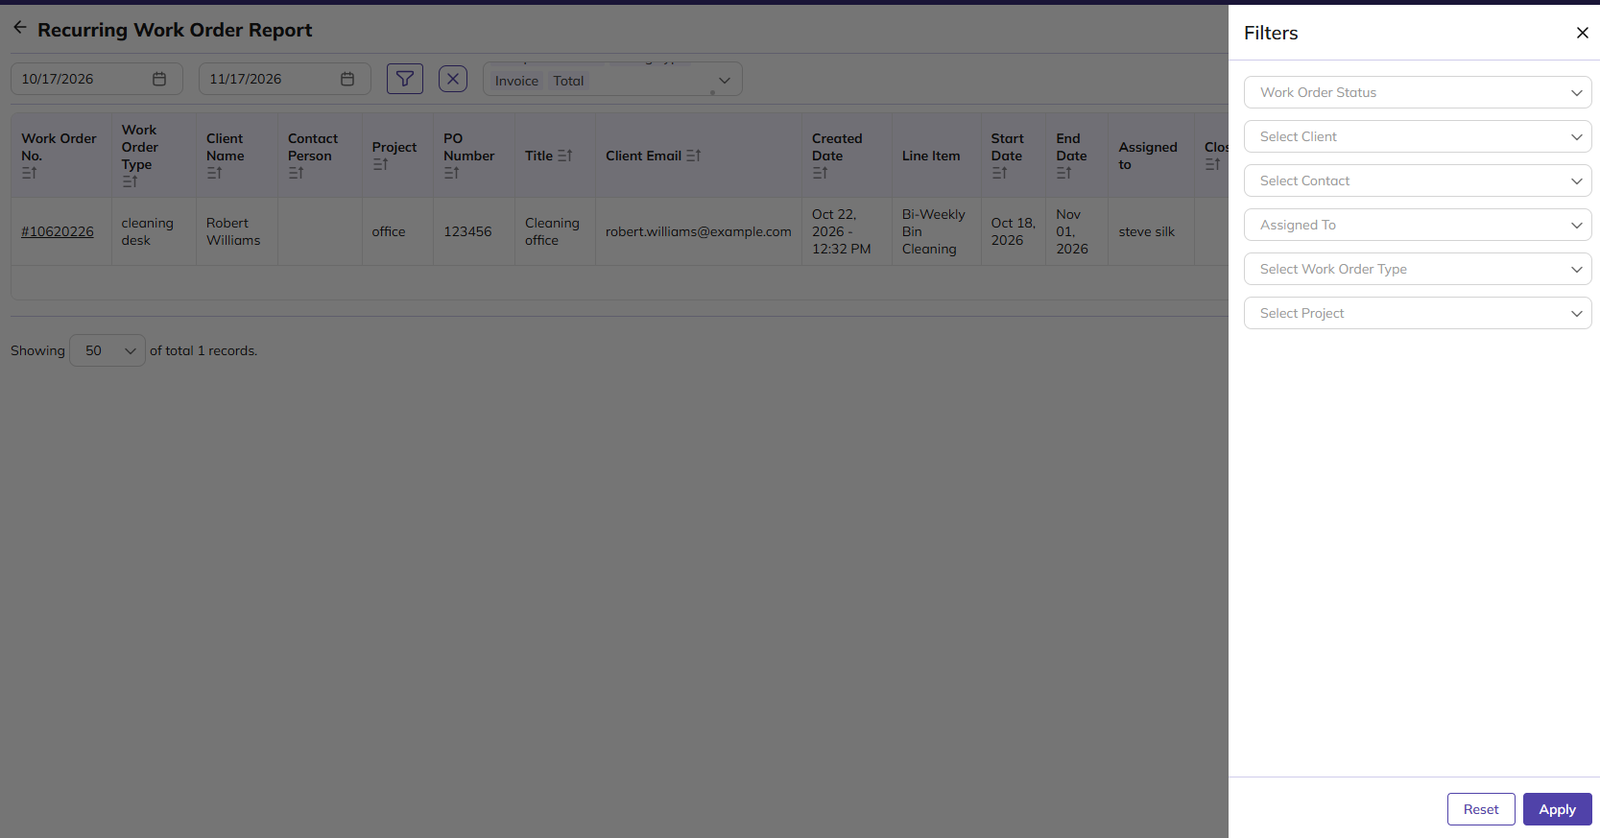
-
Click the Filter icon.
-
Set any of these filters:
-
Work Order Status: The Work Order statuses set up under Settings > Work Order Status.
-
Select Client
-
Select Contact
-
Assigned To: Show Work Orders assigned to a specific team member.
-
Select Work Order Type: The Work Order types set up under Settings > Job Type.
-
Select Project
-
-
Click Apply.
-
To clear the filters, click Reset or the X icon.
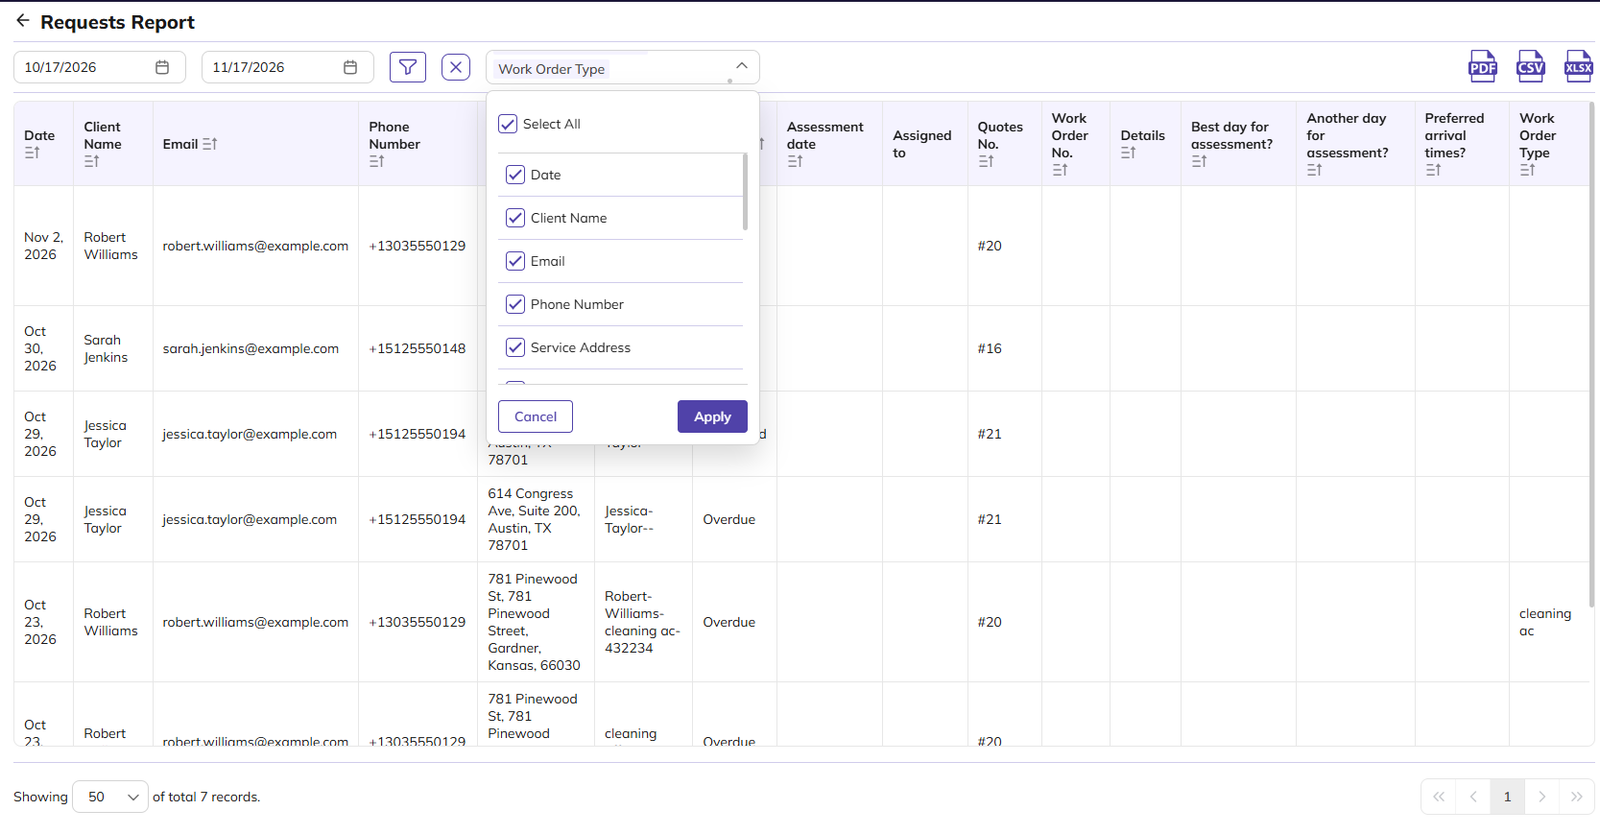
Requests Report
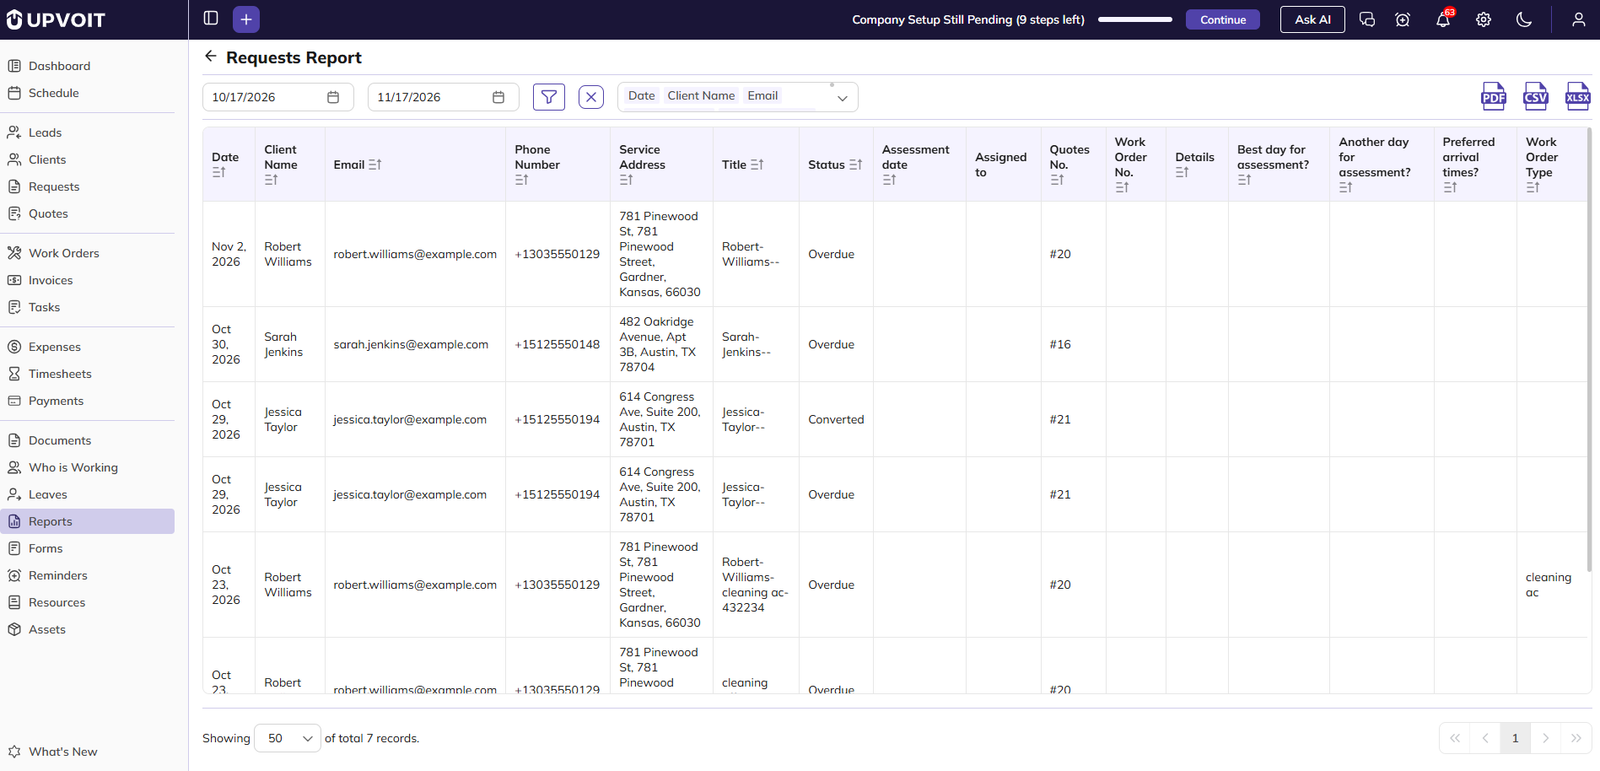
Shows client requests within a selected date range, with their status, assessment details and linked quotes or jobs.
-
Date range: Filters requests by Date, the date the request was created. By default, the report shows the last one month up to today. Change the start and end dates to view a different period.
-
Status: The current request status: New, Assessment Completed, Overdue, Today, Upcoming, Unscheduled, Converted, Archived or On The Way.
-
Assessment date: The date of the assessment visit, if one is scheduled.
-
Assigned to: The team members assigned to the assessment.
-
Quotes No. / Job No.: The quote or job created from the request.
-
Best day for assessment? / Another day for assessment? / Preferred arrival times?: The client’s preferred schedule, as entered on the request.
You can also use these controls on the report page:
-
Sort: Click the sort icon on a column header.
-
Export: Download the report as PDF, CSV or XLSX. Only the selected columns are exported.
-
Records per page: Show 20, 50 or 100 records per page.
Filtering the report:
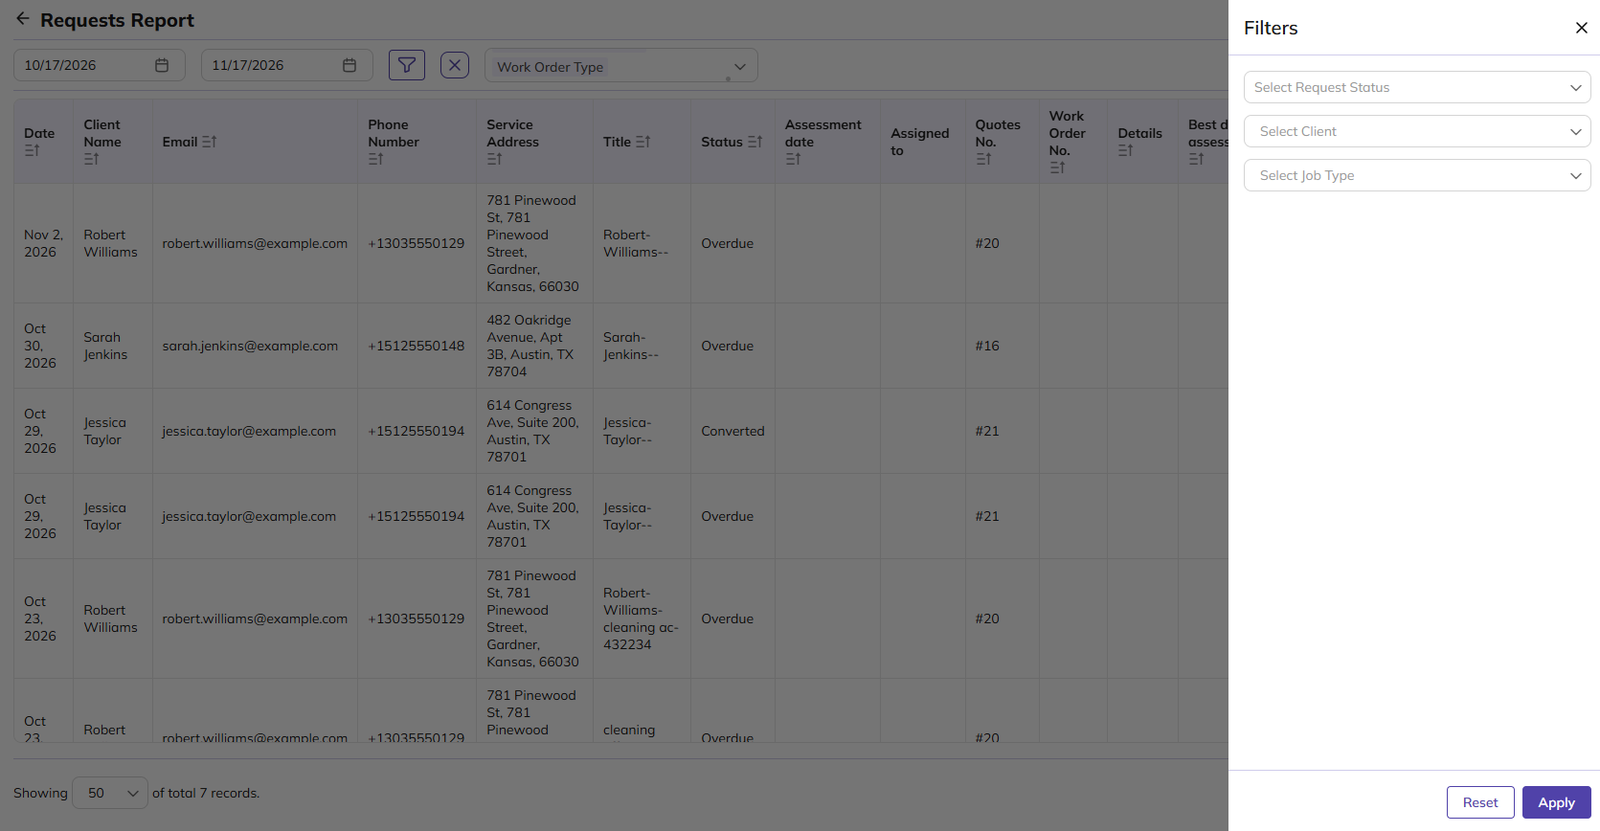
-
Click the Filter icon.
-
Set any of these filters:
-
Select Request Status: New, Assessment Completed, Overdue, Today, Upcoming, Unscheduled, Converted, Archived or On The Way.
-
Select Client
-
Select Job Type: The job types set up under Settings > Job Type.
-
-
Click Apply.
-
To clear the filters, click Reset or the X icon.
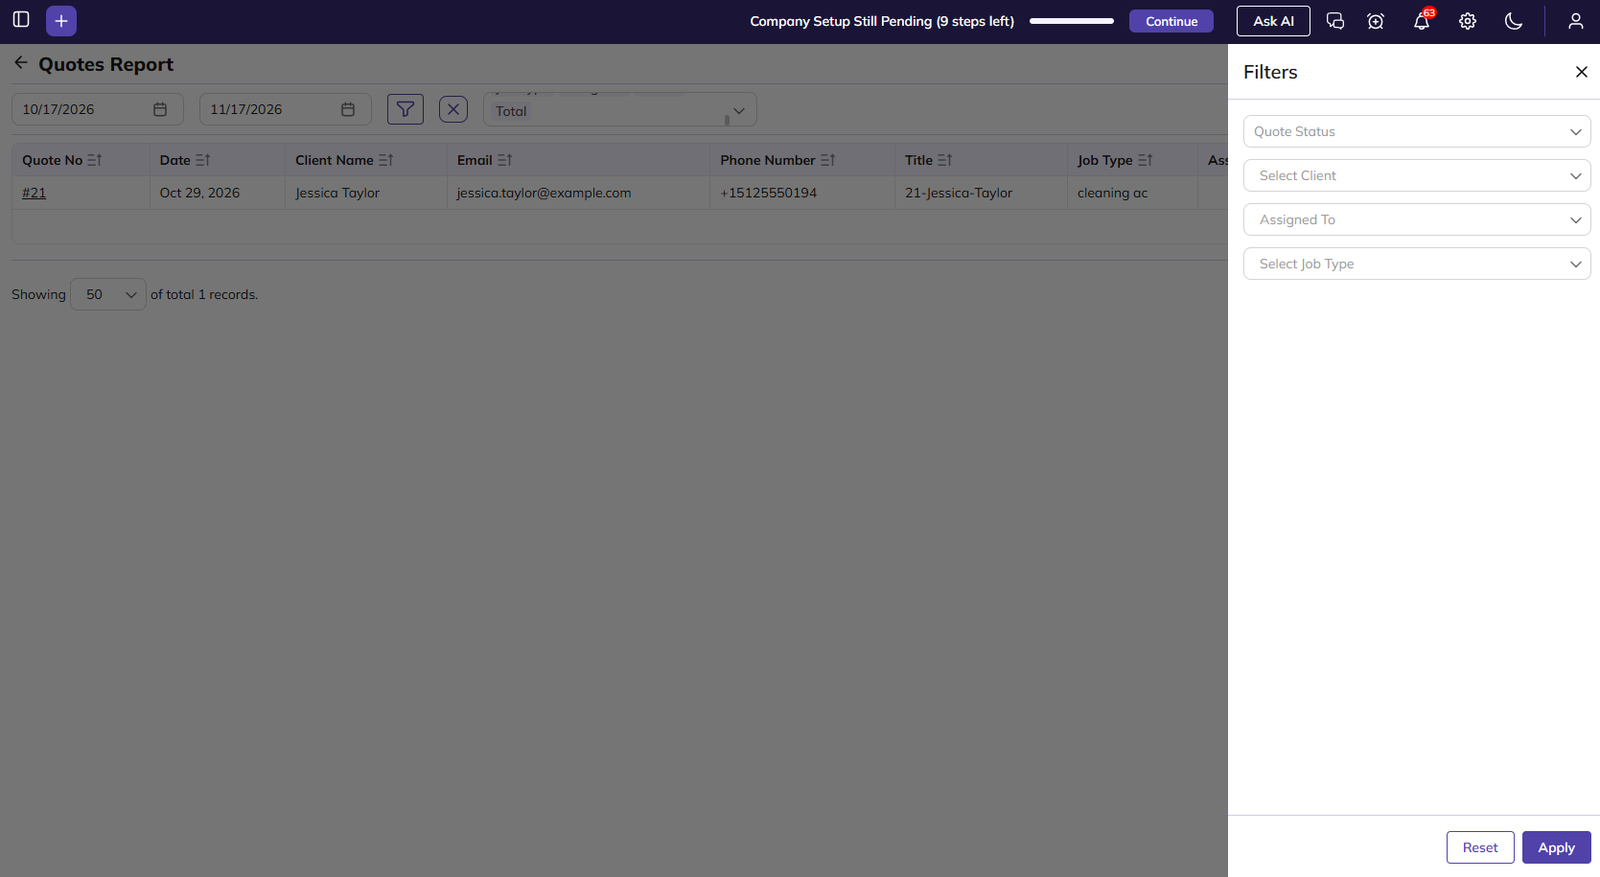
Quotes Report
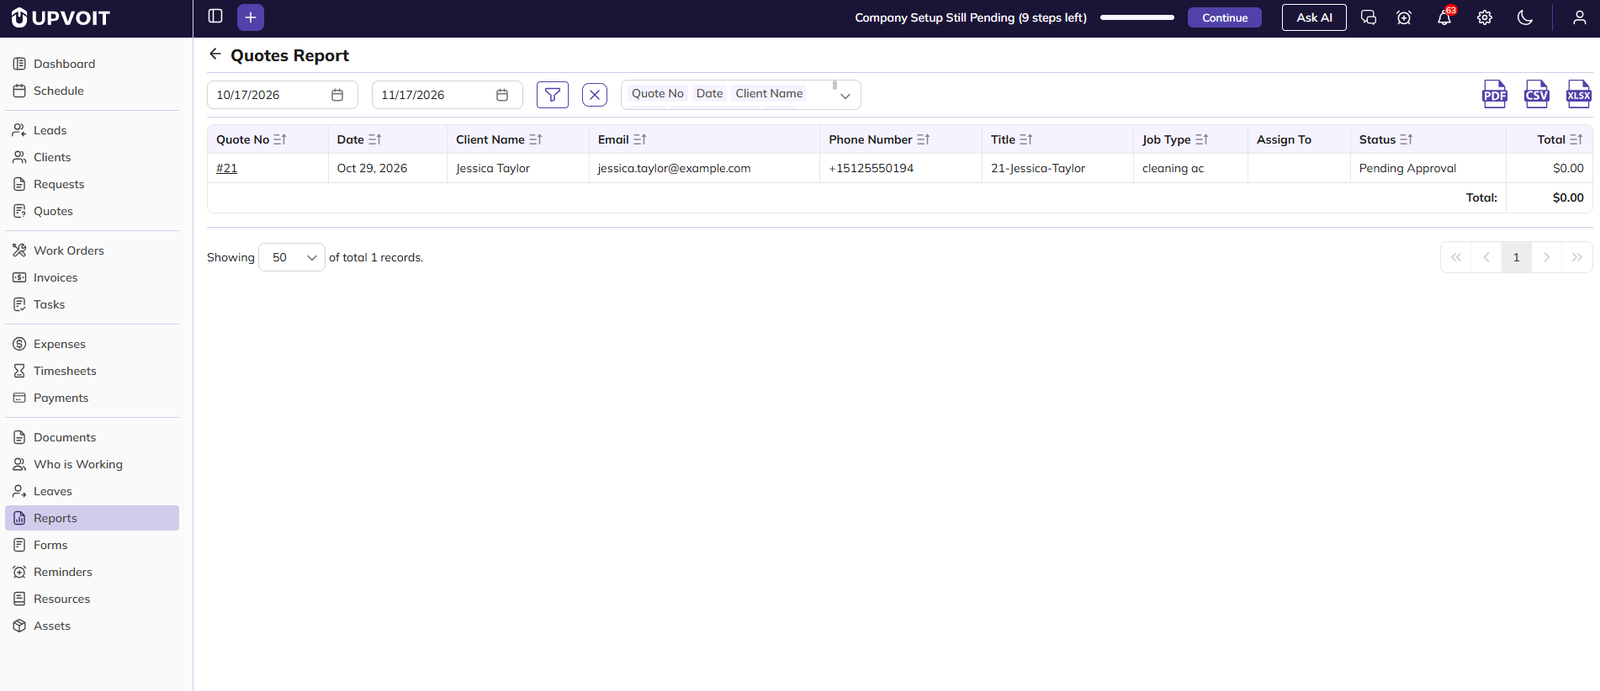
Shows quotes within a selected date range, with their client, status and total.
-
Date range: Filters quotes by Date. By default, the report shows the last one month up to today. Change the start and end dates to view a different period.
-
Quote No: Click to open the quote.
-
Assign To: The team member assigned to the quote.
-
Status: The current quote status: Created, Sent, Approved, Rejected, Expired or Pending Approval.
-
Total: The quote amount.
-
Total row: The combined Total of all listed quotes, shown at the bottom.
You can also use these controls on the report page:
-
Sort: Click the sort icon on a column header.
-
Export: Download the report as PDF, CSV or XLSX. Only the selected columns are exported.
-
Records per page: Show 20, 50 or 100 records per page.
Filtering the report:
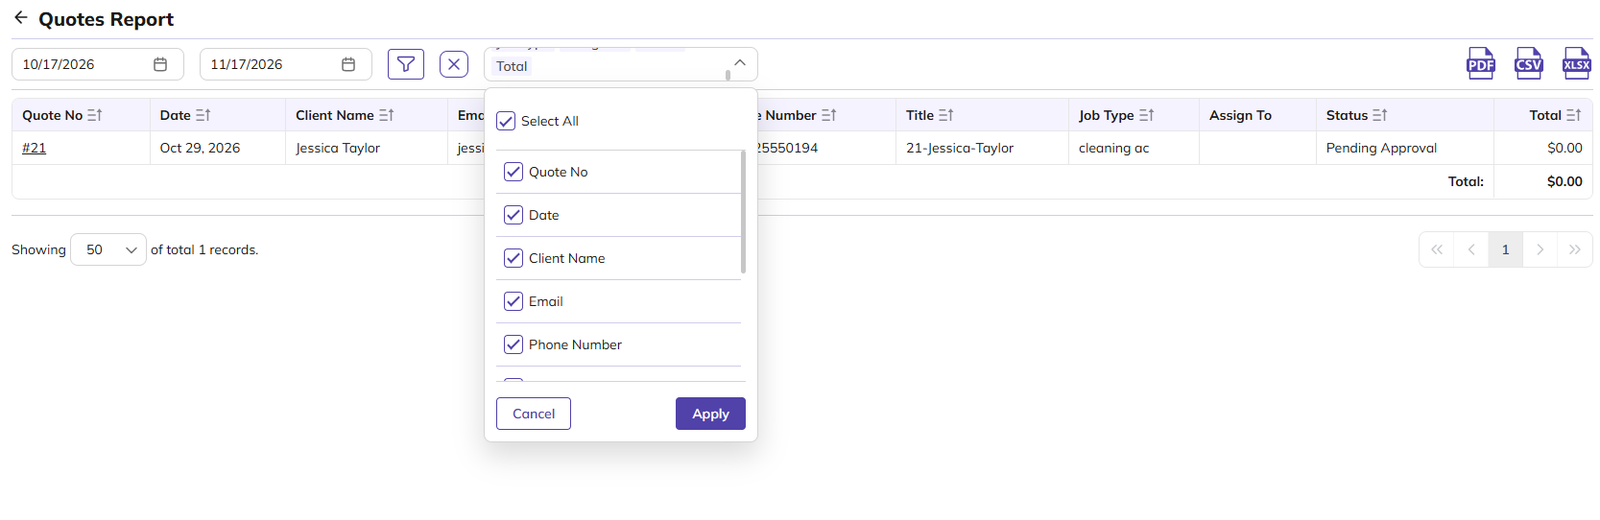
-
Click the Filter icon.
-
Set any of these filters:
-
Quote Status: Created, Sent, Approved, Rejected, Expired or Pending Approval.
-
Select Client
-
Assigned To: Show quotes assigned to a specific team member.
-
Select Job Type: The job types set up under Settings > Job Type.
-
-
Click Apply.
-
To clear the filters, click Reset or the X icon.
Timesheet Report
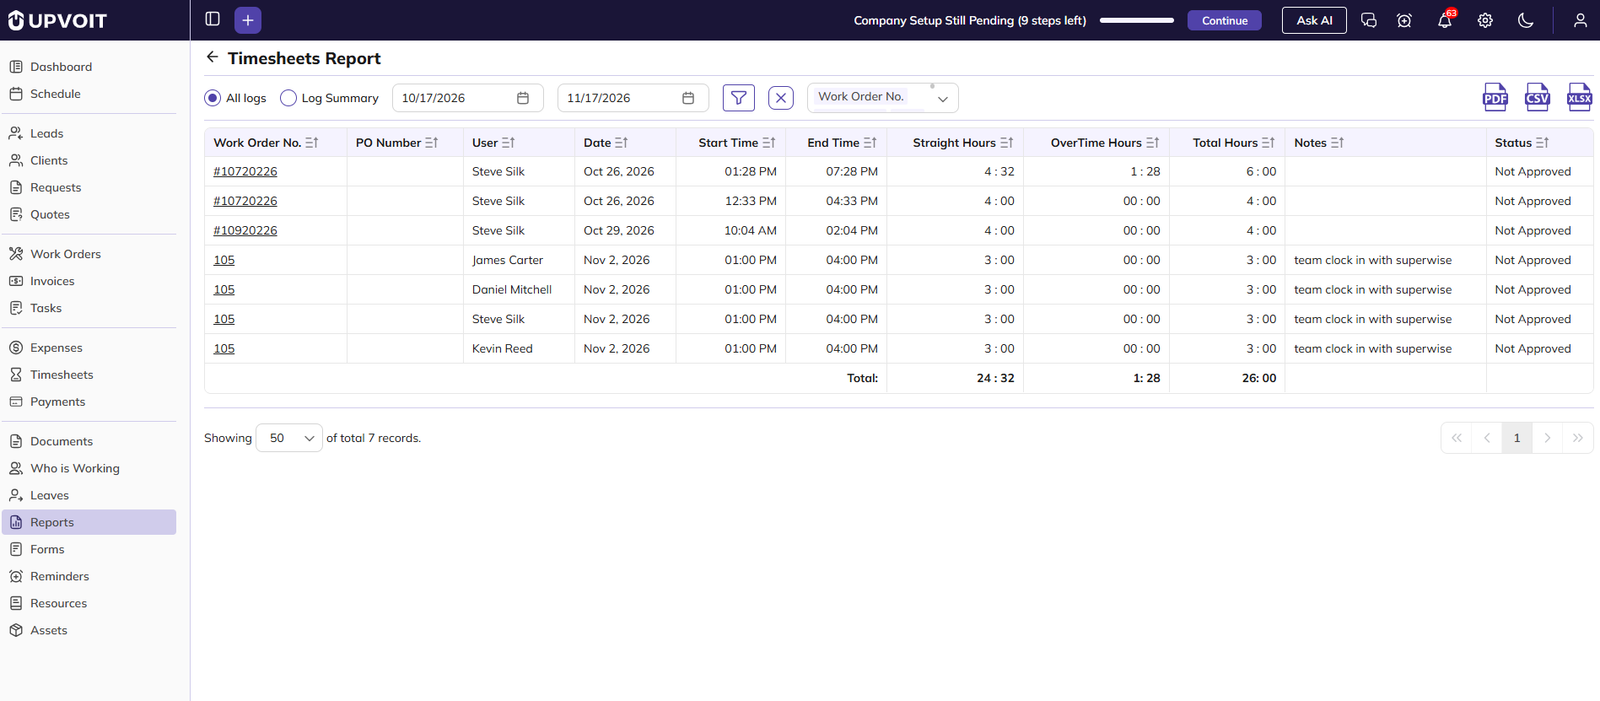
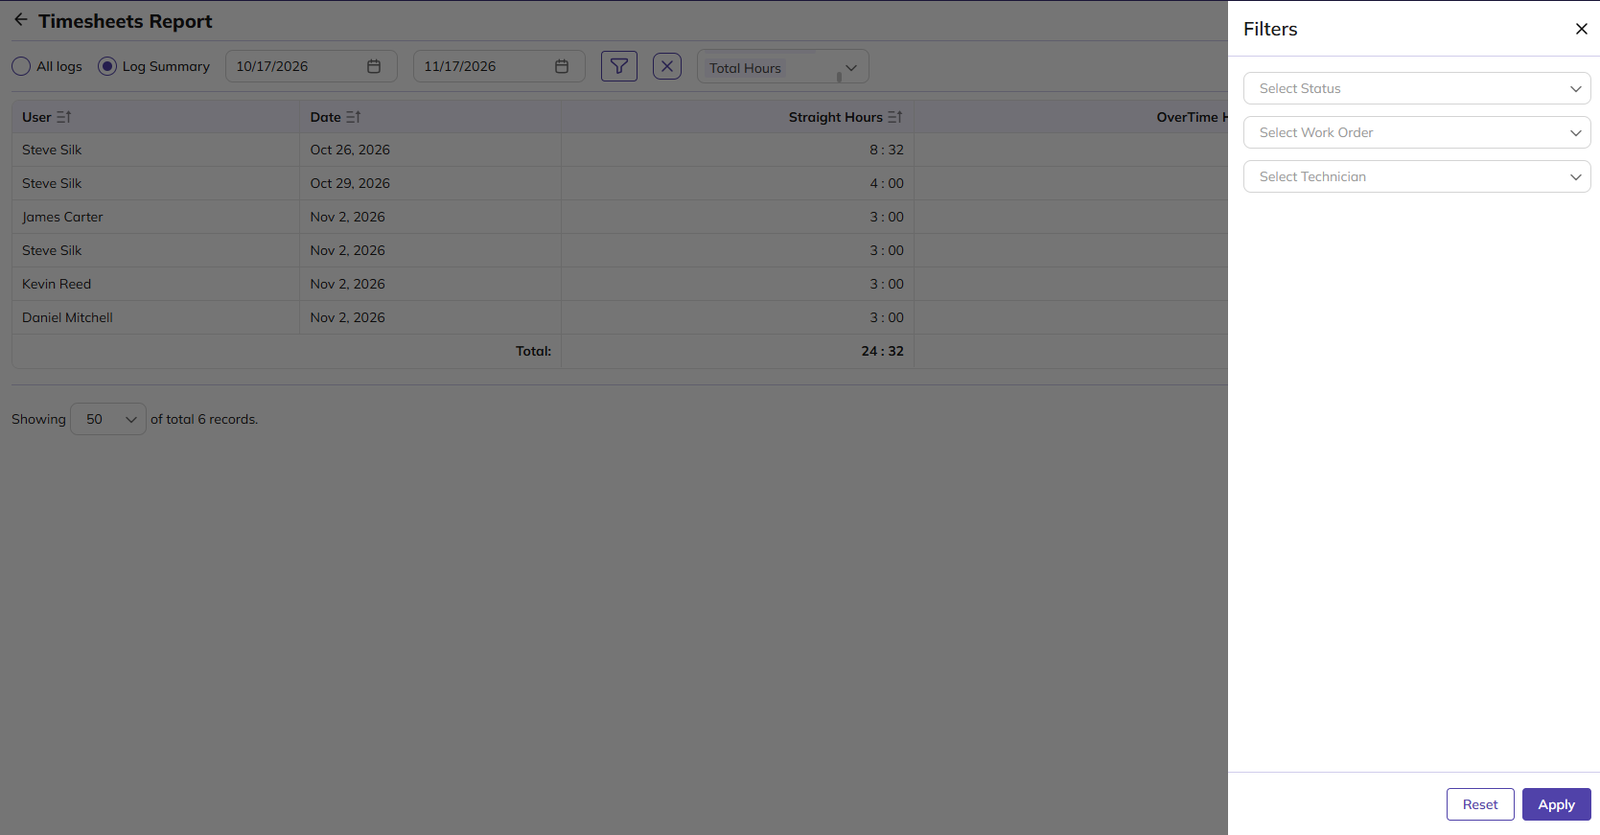
Shows time logged by the team within a selected date range.
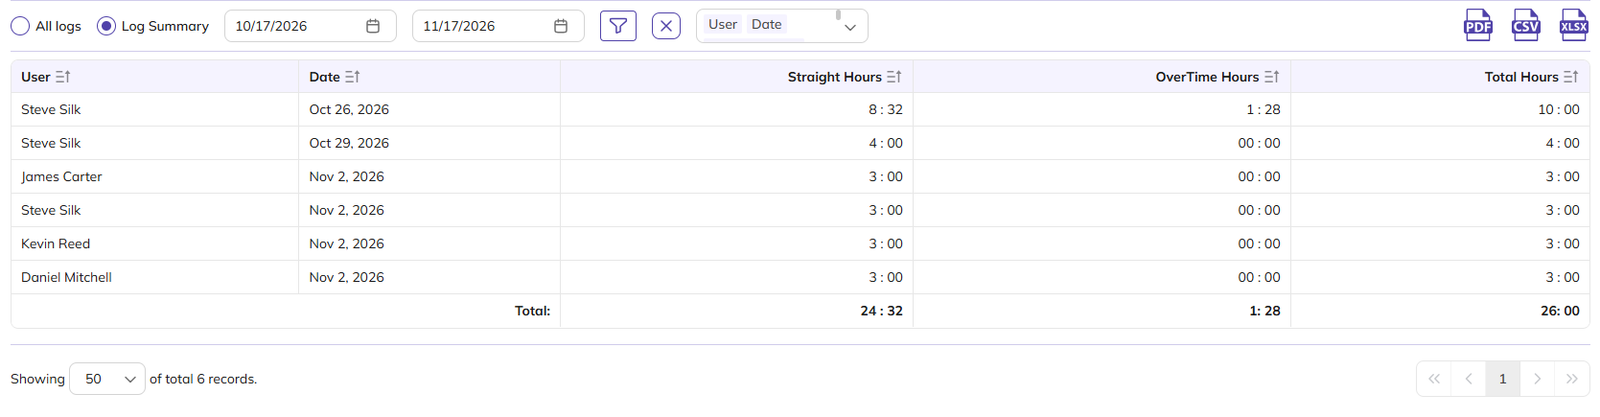
You can view the report in two ways using the options at the top left:
-
All logs: Shows each time entry on a separate row, with its job, start and end time, notes and status.
-
Log Summary: Shows one row per team member per day, with their total hours for that day.
-
Date range: By default, the report shows the last one month up to today. Change the start and end dates to view a different period.
-
Job No.: Click to open the job. Shown in All logs view.
-
Straight Hours / OverTime Hours: The regular and overtime hours worked.
-
Total Hours: Straight Hours plus OverTime Hours.
-
Notes: Any notes added to the time entry, such as Auto Clock In.
-
Status: Shows whether the time entry is Approved or Not Approved. Time entries are approved under Timesheets > Approve Timesheets.
-
Total: The combined hours of all listed entries, shown at the bottom.
-
You can also use these controls on the report page:
-
Sort: Click the sort icon on a column header.
-
Export: Download the report as PDF, CSV or XLSX. Only the selected columns are exported.
-
Records per page: Show 20, 50 or 100 records per page.
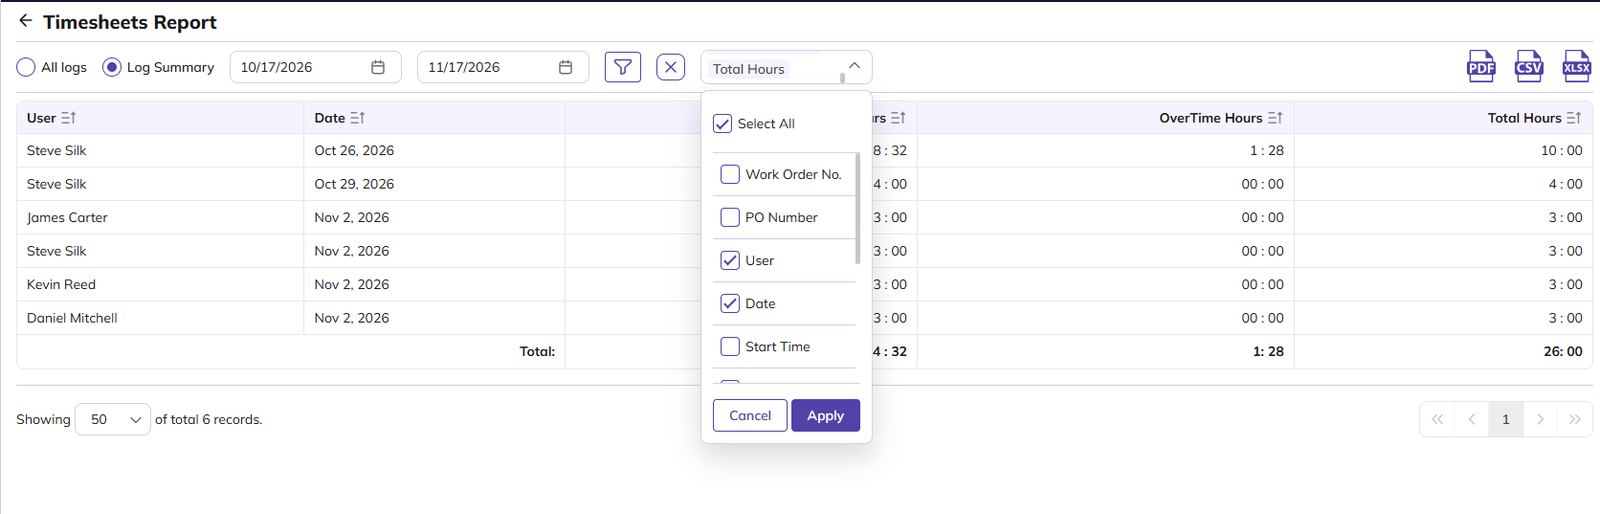
In Log Summary view, Job No., PO Number, Start Time, End Time, Notes and Status are hidden by default.
Filtering the report:
-
Click the Filter icon.
-
Set any of these filters:
-
Select Status: Approved or Not Approved.
-
Select Job
-
Select Technician: Show time logged by a specific team member.
-
-
Click Apply.
-
To clear the filters, click Reset or the X icon.
Feedback Report
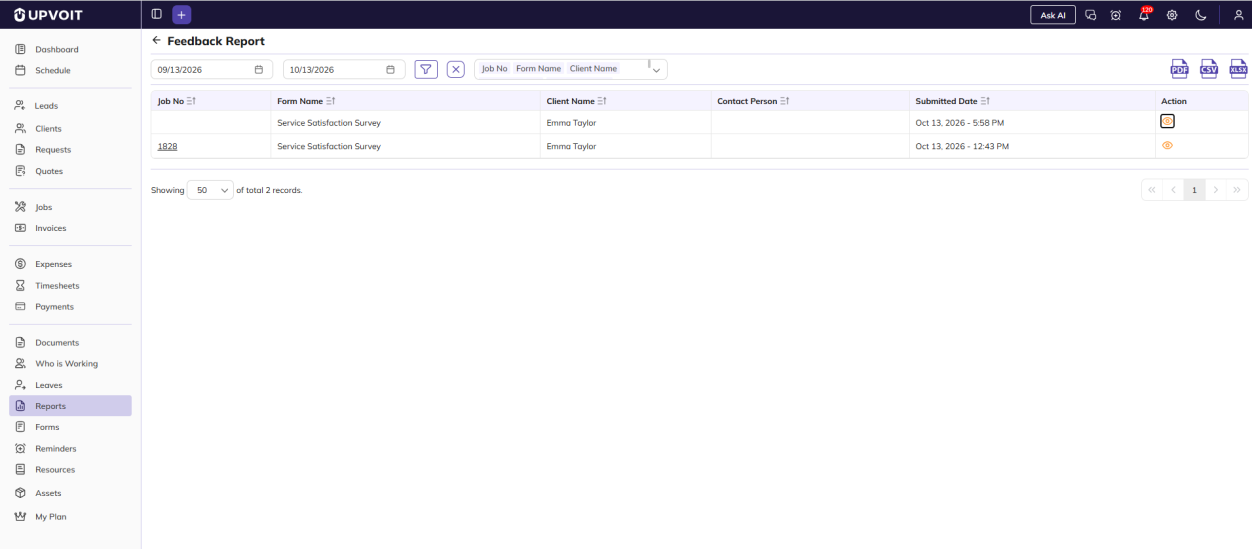
Shows feedback forms submitted by clients within a selected date range.
Feedback can be sent to a client in two ways:
-
From the Feedback section on the client’s details page.
-
From a job, once the job is completed.
When the client submits the form, it appears in this report.
-
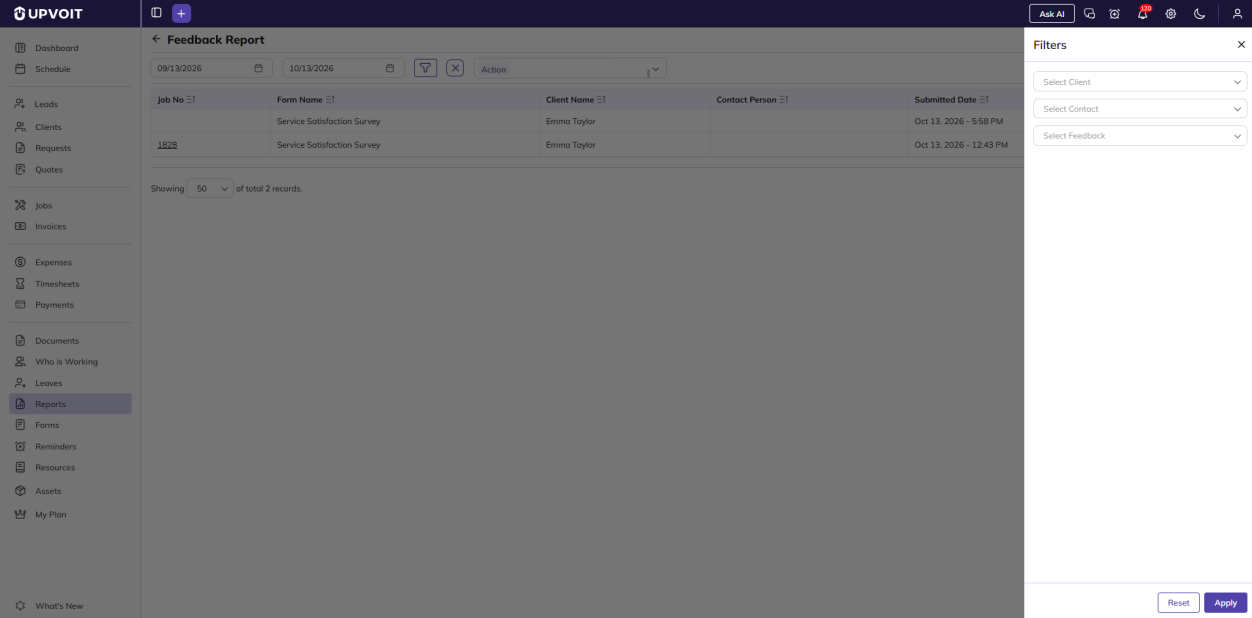
Date range: Filters feedback by Submitted Date. By default, the report shows the last one month up to today. Change the start and end dates to view a different period, or click the X icon to clear the dates and see all feedback.
-
Job No: The job the feedback was sent from. Click to open the job. This is blank when feedback was sent from the client’s details page.
-
Form Name: The feedback form the client filled in. Feedback forms are set up under Settings > Feedback.
-
Submitted Date: The date and time the client submitted the feedback.
-
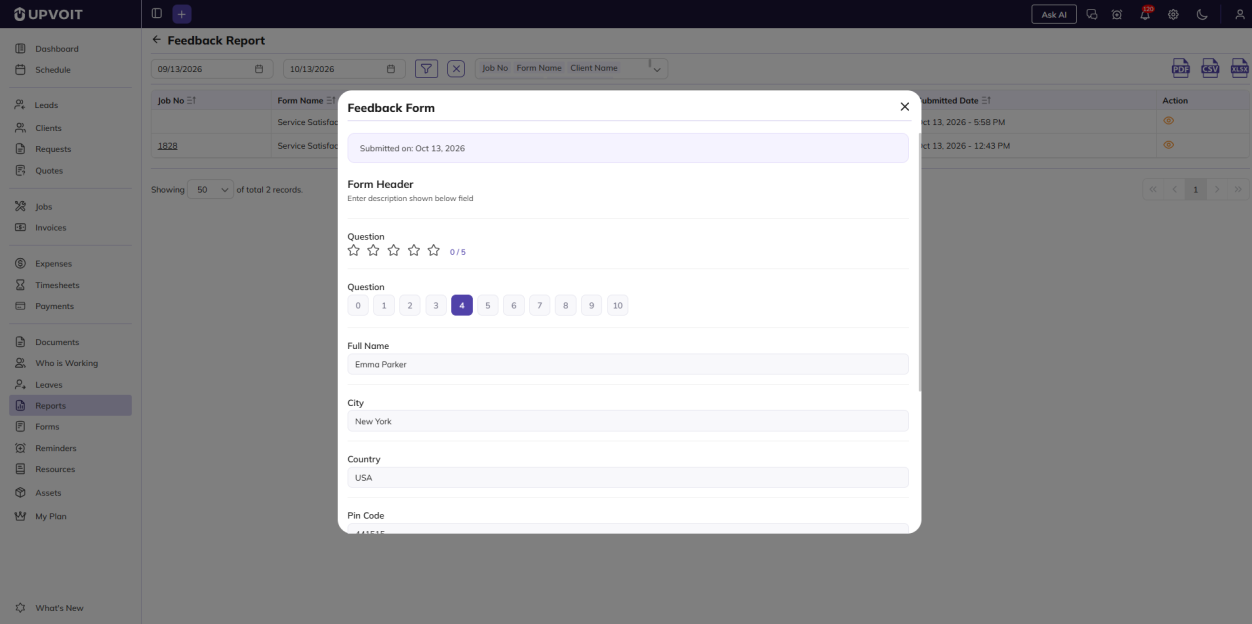
Action: Click the View (eye) icon to open the submitted Feedback Form. It shows the submission date and the client’s answers to each question, such as star ratings, number scores and text fields.
You can also use these controls on the report page:
-
Sort: Click the sort icon on a column header.
-
Export: Download the report as PDF, CSV or XLSX. Only the selected columns are exported.
-
Records per page: Show 20, 50 or 100 records per page.
Filtering the report:
-
Click the Filter icon.
-
Set any of these filters:
-
Select Client
-
Select Contact
-
Select Feedback: Show responses to a specific feedback form set up under Settings > Feedback.
-
-
Click Apply.
-
To clear the filters, click Reset or the X icon.
Labor & Expense Report
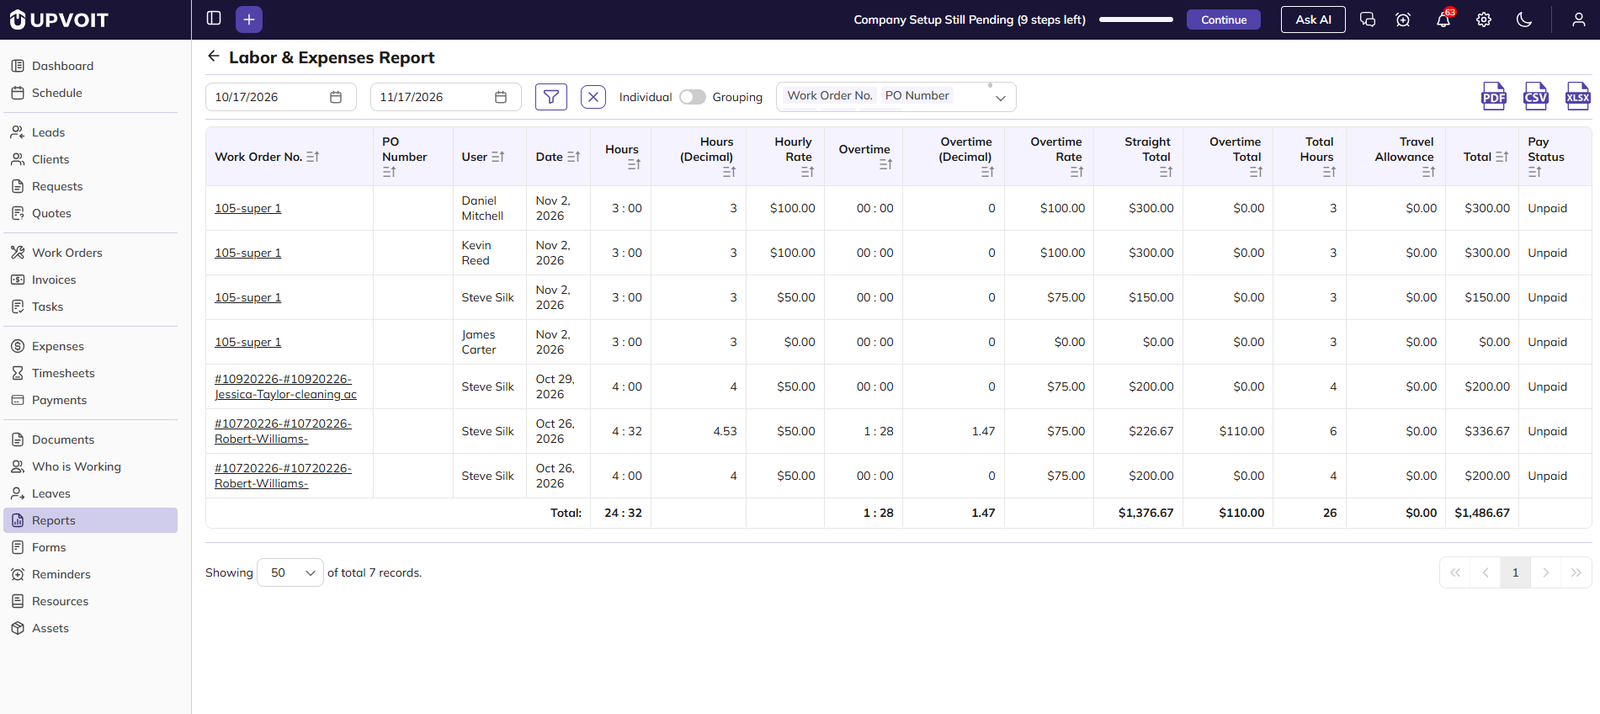
Shows the labor cost of time logged on jobs within a selected date range, calculated from hours worked and each team member’s pay rates. The report opens as Labor Cost Report.
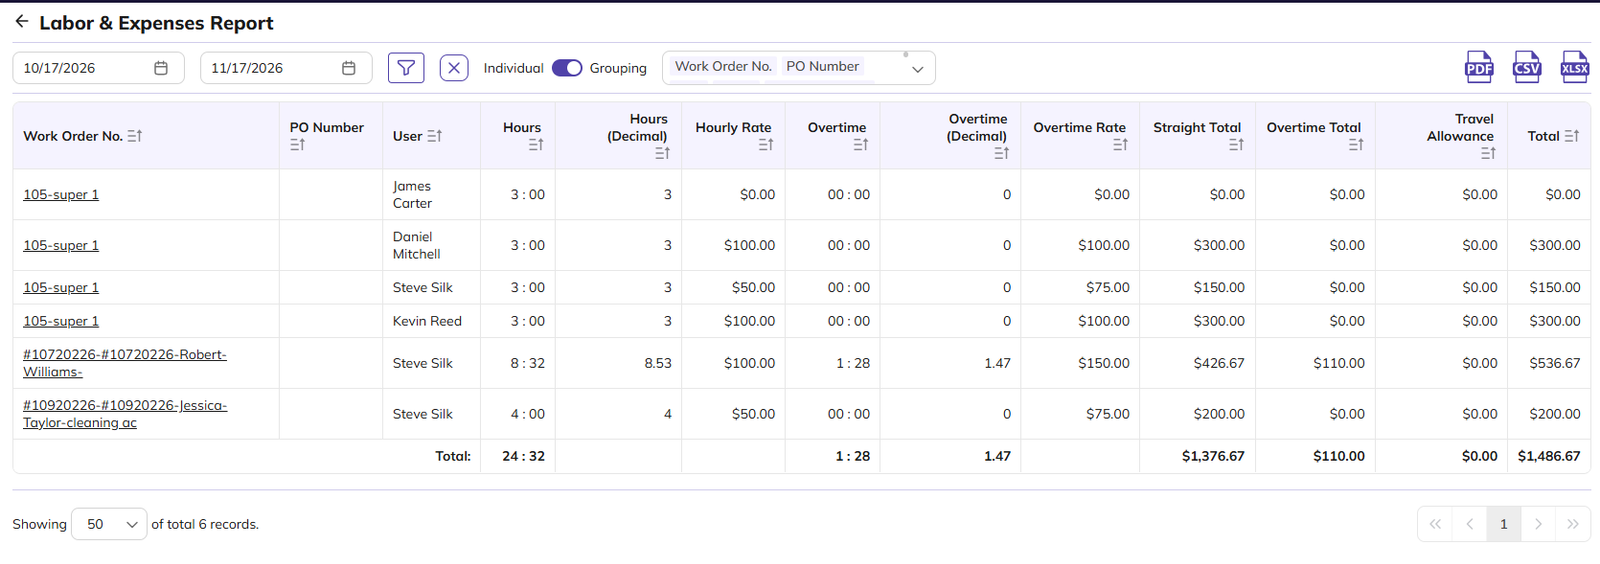
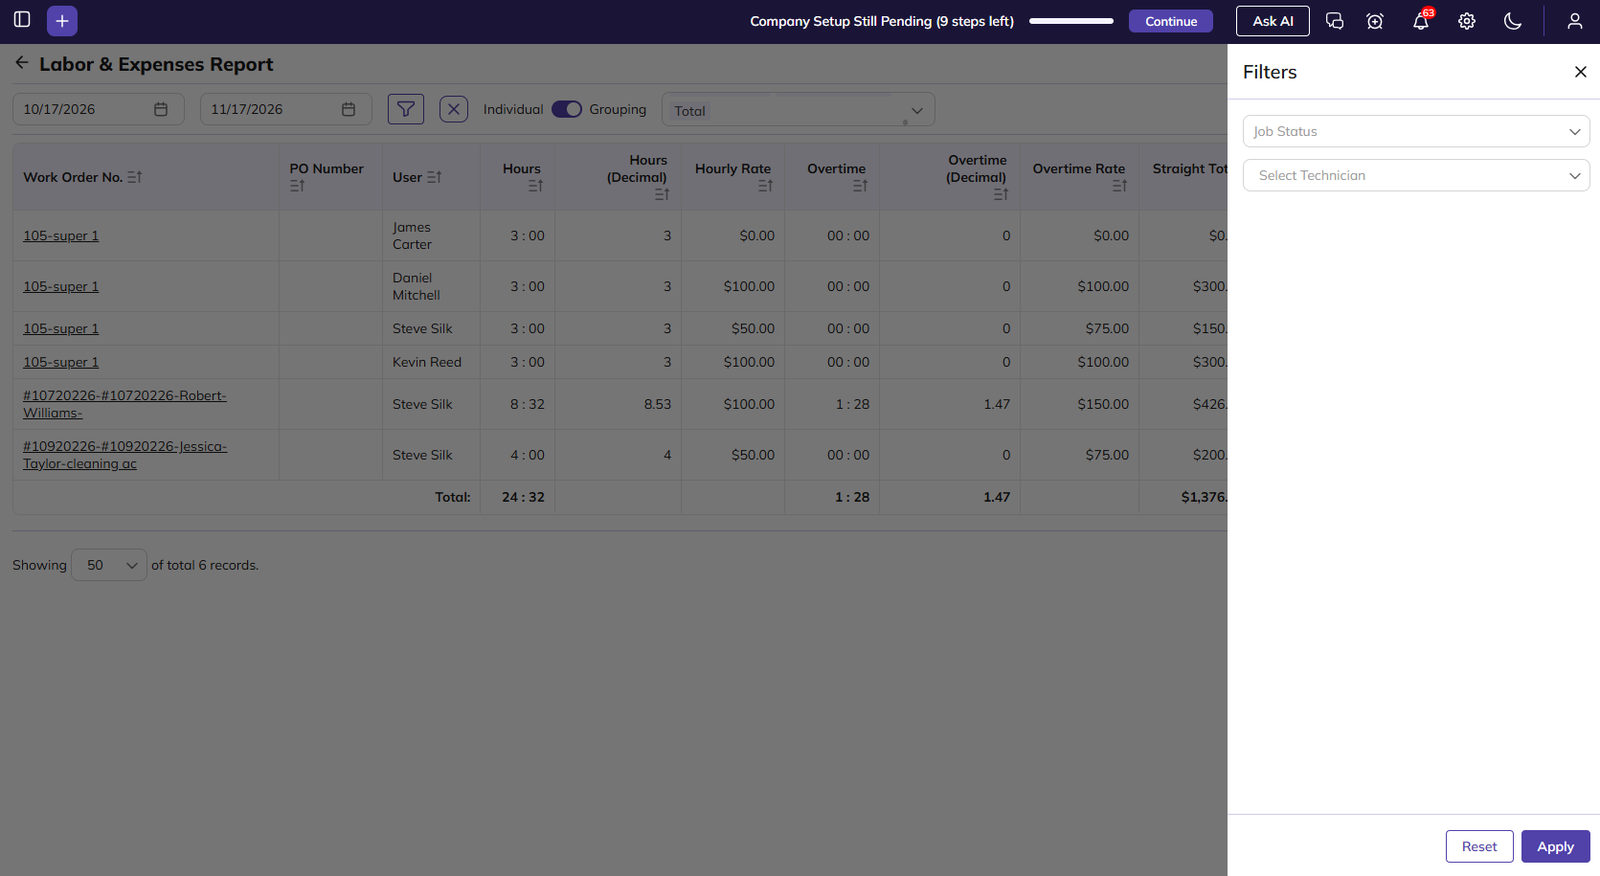
You can view the report in two ways using the Individual / Grouping toggle at the top:
-
Individual (toggle off): Shows each time entry on a separate row, with its date and pay status.
-
Grouping (toggle on): Combines all entries for the same job and team member into one row.
-
Date range: By default, the report shows the last one month up to today. Change the start and end dates to view a different period.
-
Job No.: Click to open the job.
-
Hours / Overtime: The straight and overtime hours worked, in hours and minutes.
-
Hours (Decimal) / Overtime (Decimal): The same hours as decimal numbers, used in the cost calculation. For example, 3:50 is 3.83.
-
Hourly Rate / Overtime Rate: The team member’s pay rate for straight and overtime hours.
-
Straight Total / Overtime Total: Decimal hours × rate.
-
Total Hours: Straight plus overtime hours. Shown in Individual view.
-
Travel Allowance: The travel amount for the entry, calculated from travel miles and the travel rate.
-
Total: Straight Total + Overtime Total + Travel Allowance.
-
Pay Status: Shows whether the entry is Paid or Unpaid. Shown in Individual view.
-
Total row: The combined values of all listed entries, shown at the bottom.
-
You can also use these controls on the report page:
-
Sort: Click the sort icon on a column header.
-
Export: Download the report as PDF, CSV or XLSX. Only the selected columns are exported.
-
Records per page: Show 20, 50 or 100 records per page.
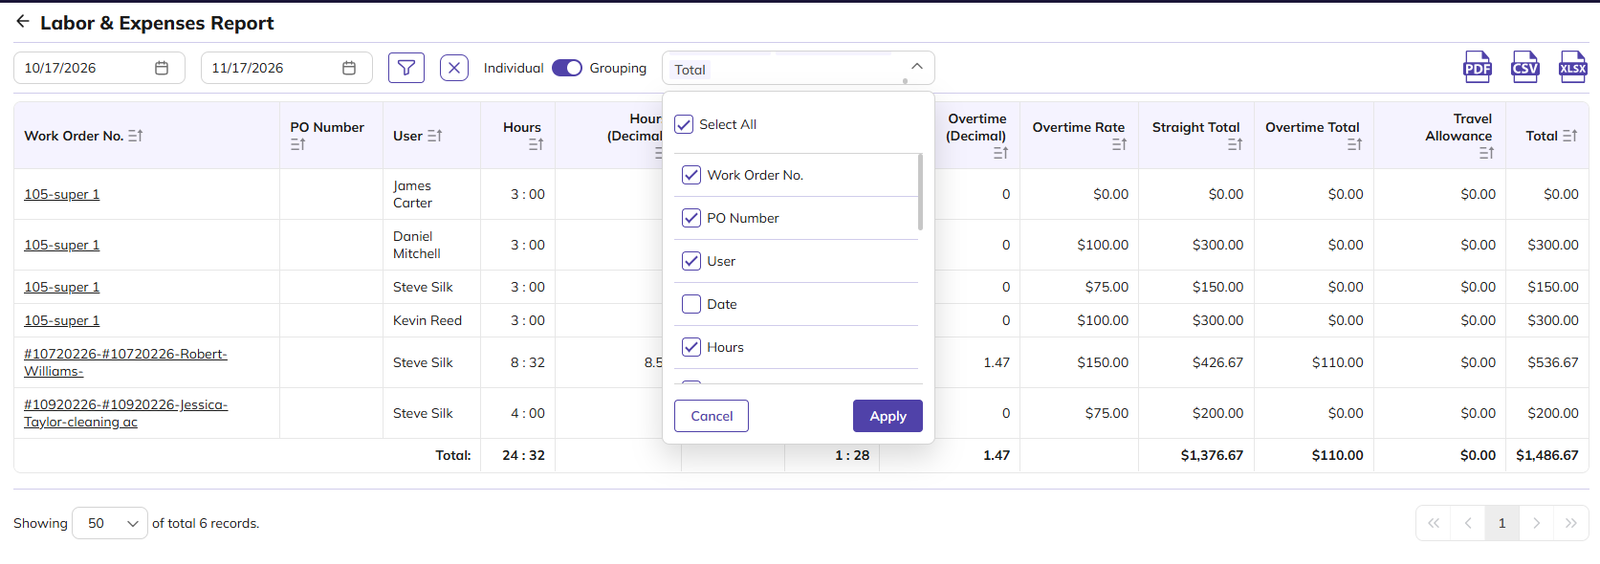
In Grouping view, Date is hidden by default.
Filtering the report:
-
Click the Filter icon.
-
Set any of these filters:
-
Job Status: Created, Scheduled, In Progress, On Hold, Waiting For Parts, Completed or Cancelled. These are set up under Settings > Work Order Status.
-
Select Technician: Show entries for a specific team member.
-
-
Click Apply.
-
To clear the filters, click Reset or the X icon.
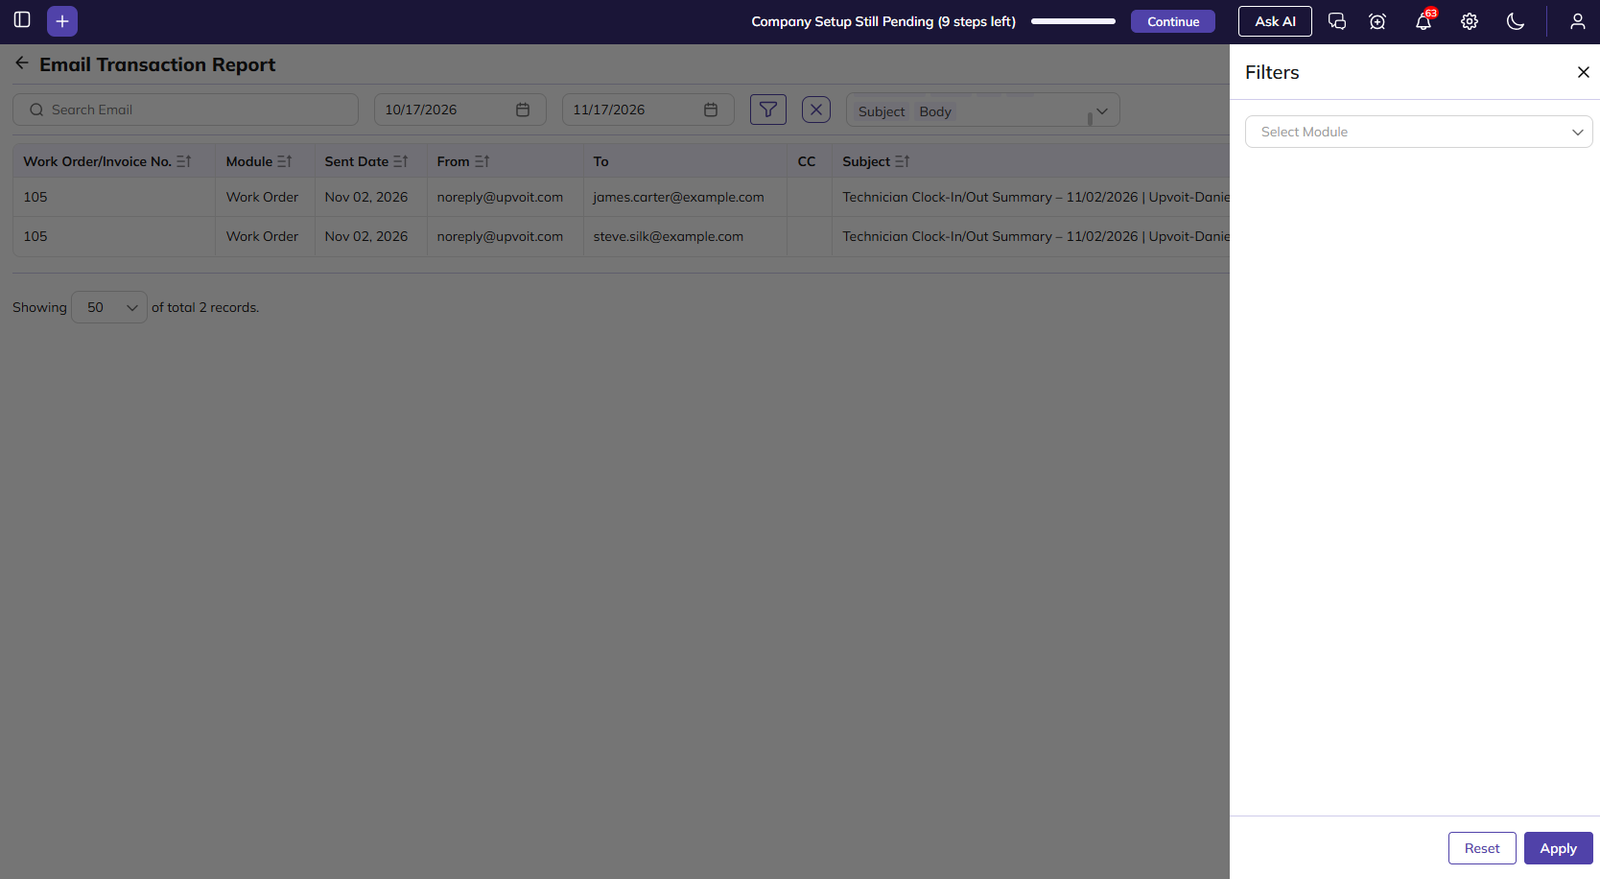
Email Transaction Report
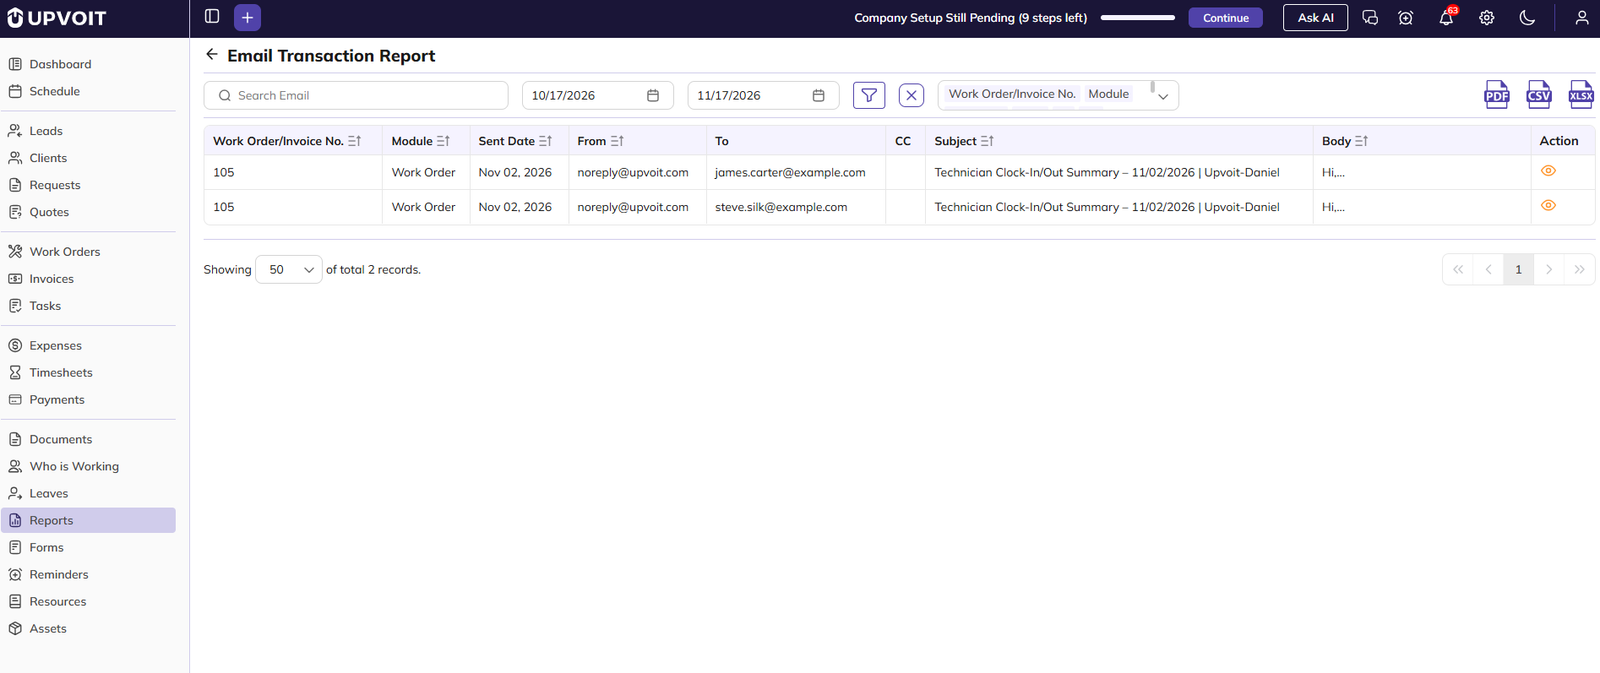
Shows emails sent from jobs and invoices within a selected date range, with the recipients, subject and message.
-
Search: Type in the Search Email box to find matching emails.
-
Date range: Filters emails by Sent Date. By default, the report shows the last one month up to today. Change the start and end dates to view a different period, or click the X icon to clear the dates and see all emails.
-
Job/Invoice No.: The job or invoice the email was sent from.
-
Module: Shows whether the email was sent from a Job or an Invoice.
-
From / To / CC: The sender and recipients of the email.
-
Subject / Body: The email subject and the start of the message.
-
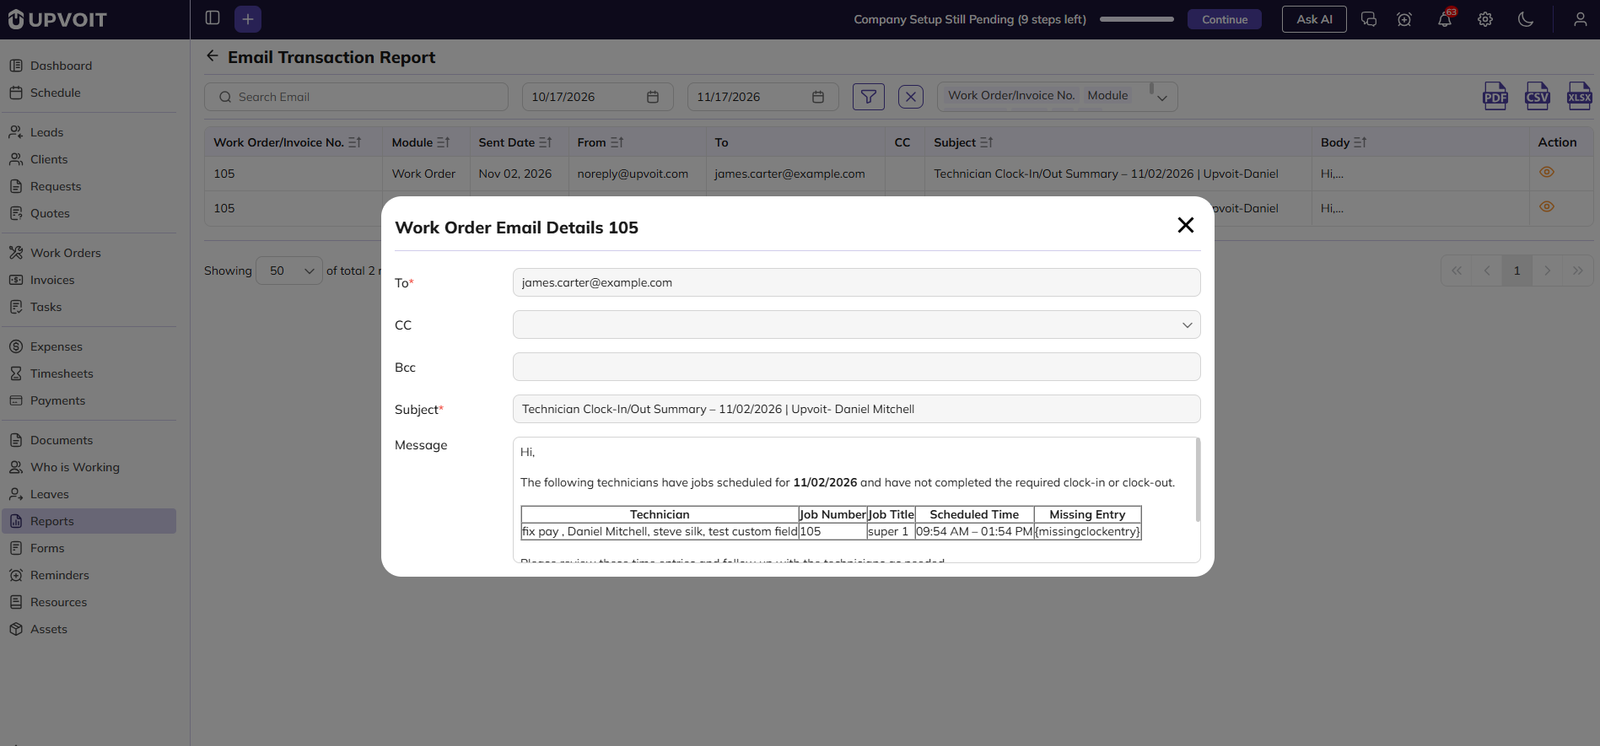
Action: Click the View (eye) icon to open the Email Details. It shows the full email, including the To, CC and Bcc recipients, the subject and the complete message.
You can also use these controls on the report page:
-
Sort: Click the sort icon on a column header.
-
Export: Download the report as PDF, CSV or XLSX. Only the selected columns are exported.
-
Records per page: Show 20, 50 or 100 records per page.
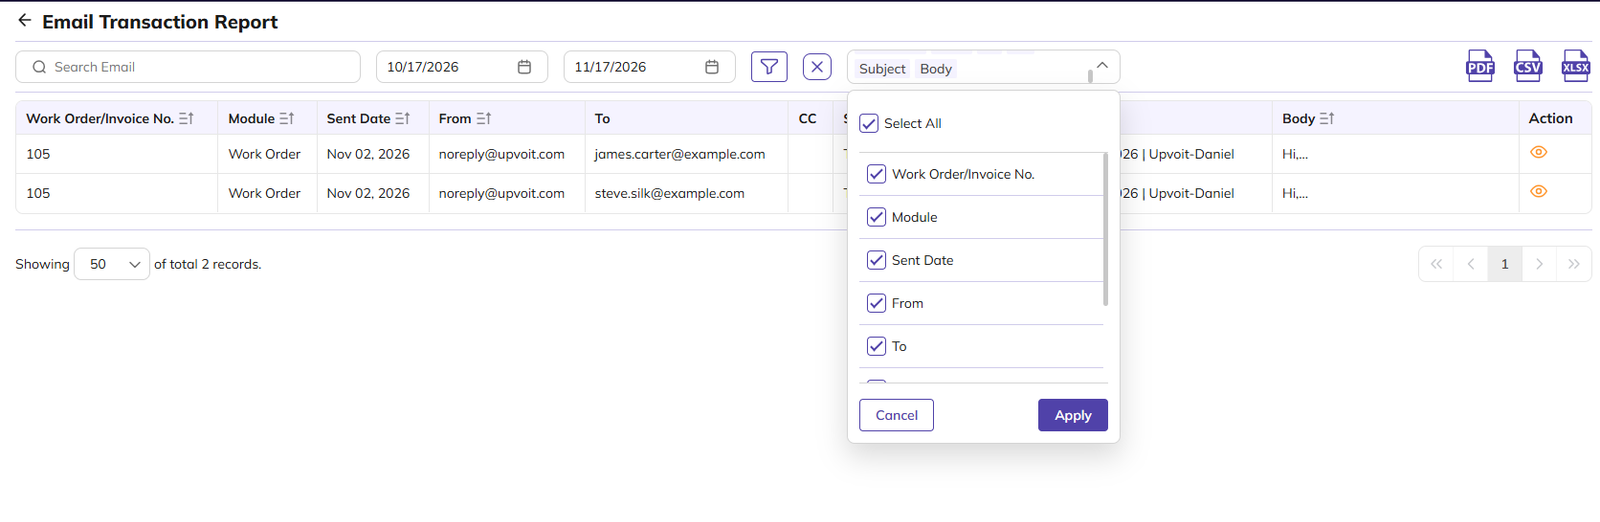
Filtering the report:
-
Click the Filter icon.
-
Select a Module, either Job or Invoice.
-
Click Apply.
-
To clear the filter, click Reset or the X icon.
Custom Reports
Custom Reports are reports you create yourself by describing what you need to Upvoit AI. They are listed under Custom Reports on the Reports page. This feature is currently in Beta.
Creating a Custom Report
-
On the Reports page, click Create Custom Report With AI at the top right.
-
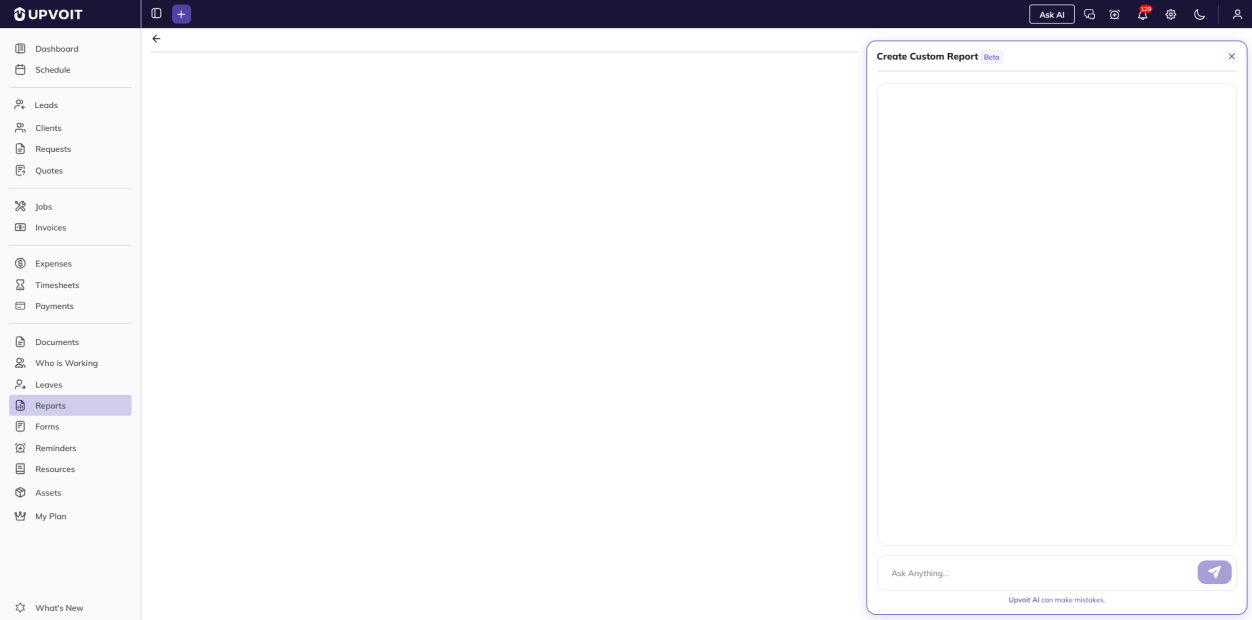
The Create Custom Report panel opens on the right.
-
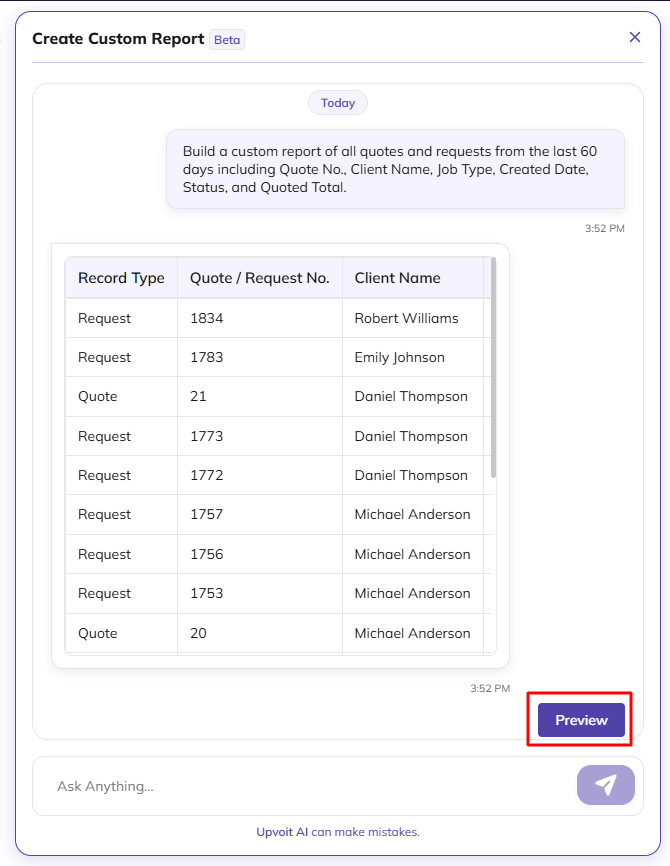
In the Ask Anything box, describe the report you need, for example “create client report”, and click the Send icon. Upvoit AI shows a sample of the report table in the panel.
-
Click Preview to see the full report on the page. The Preview button changes to Save.
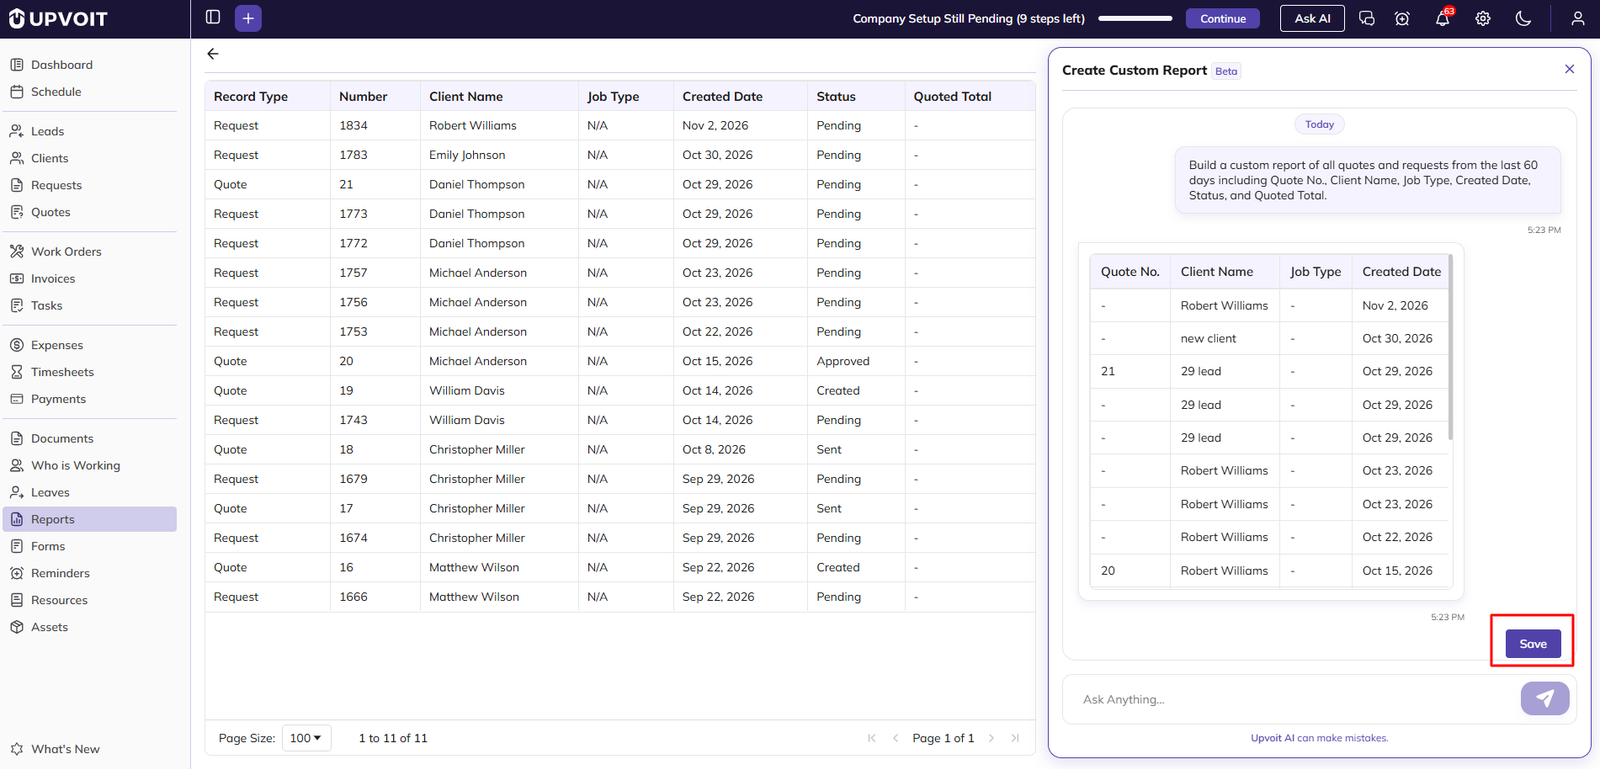
-
Click Save. In the Report Name pop-up, enter a name for the report and click Save.
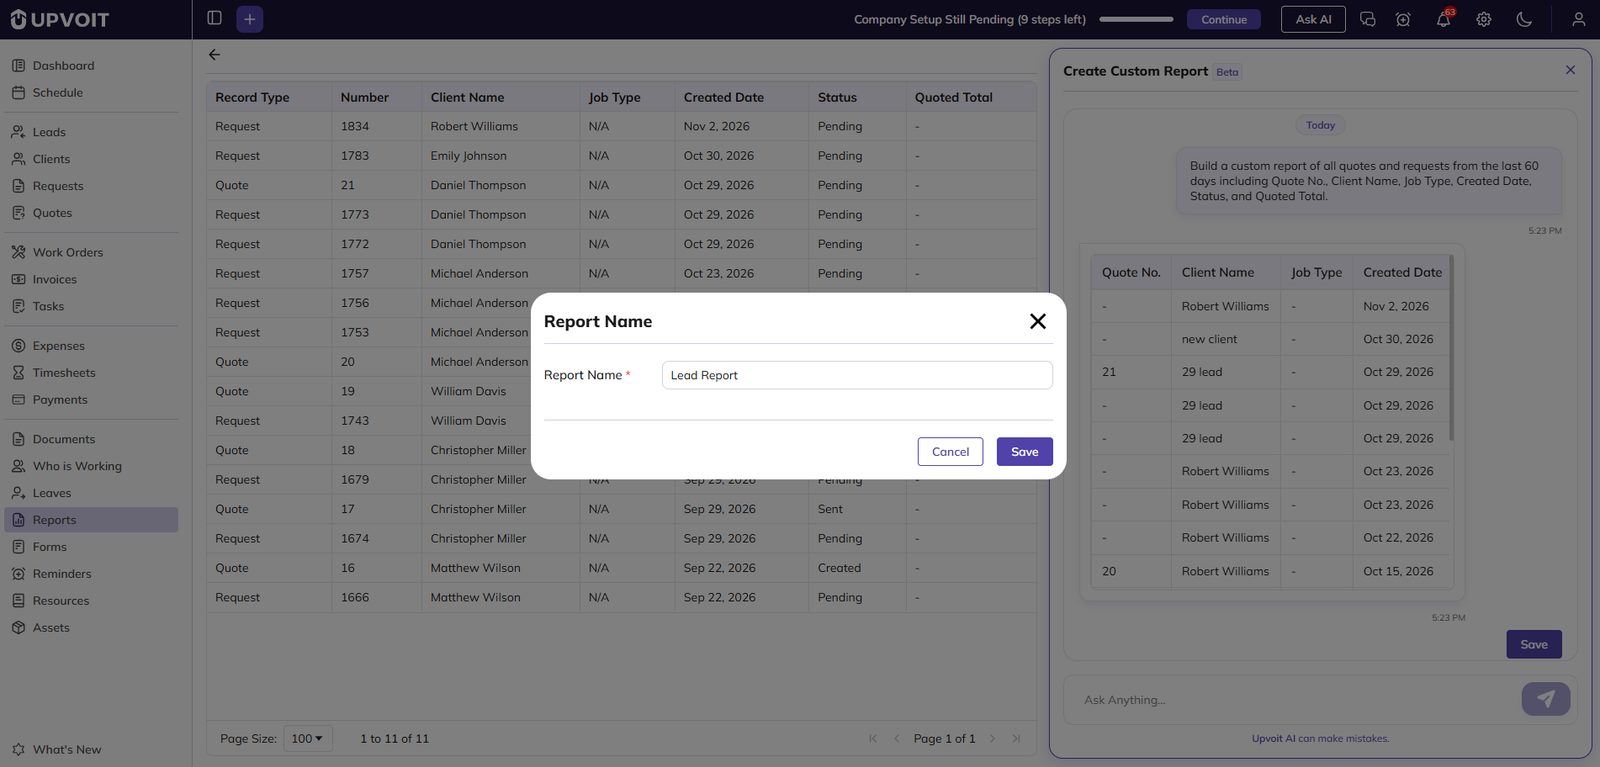
-
The report is created and appears under Custom Reports on the Reports page.
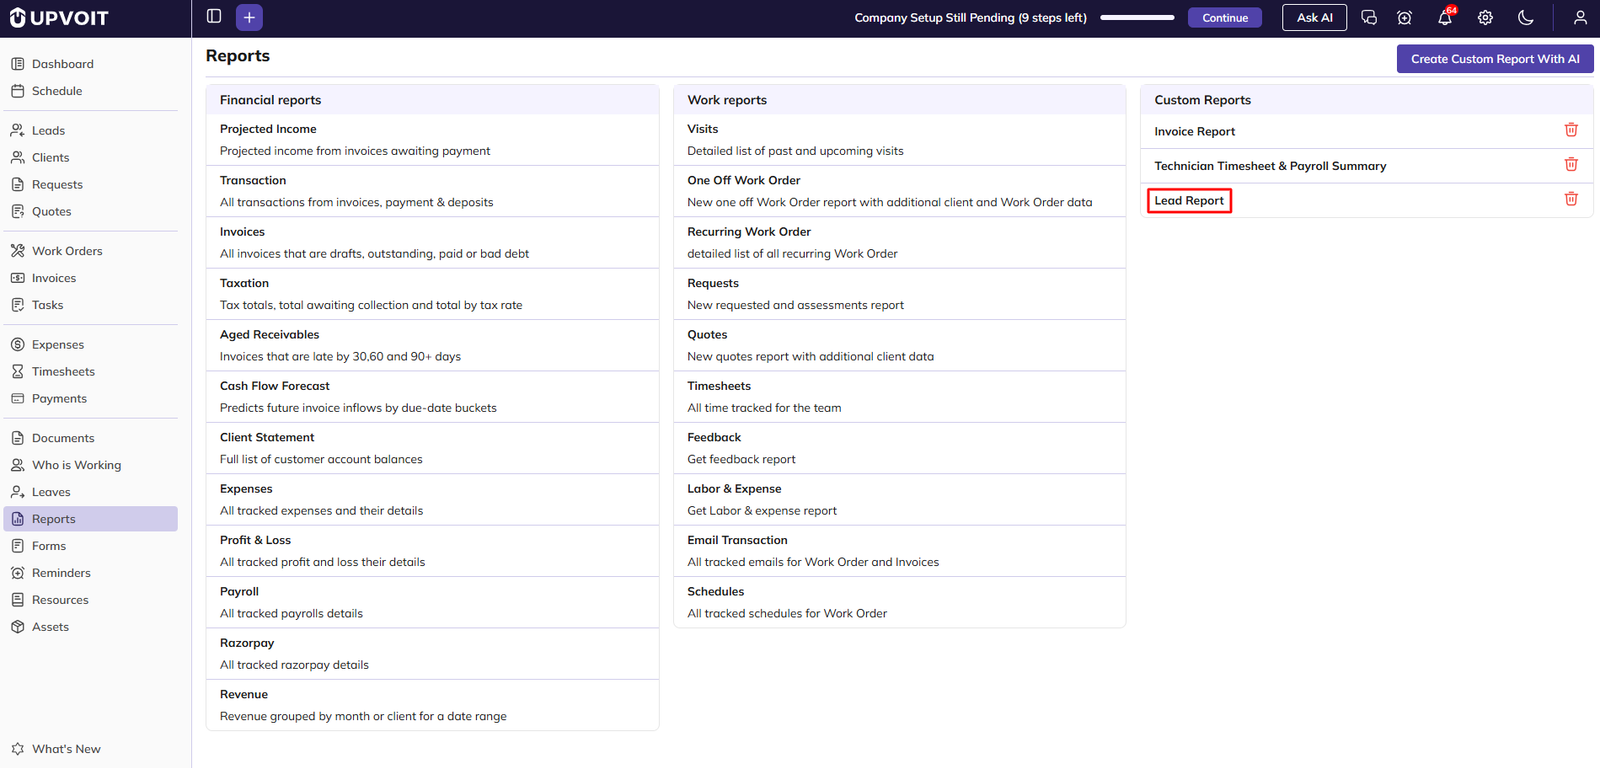
Upvoit AI can make mistakes, so check the preview before saving the report. Once a report is saved, its columns cannot be changed. To use different columns, create a new report and delete the old one.
Viewing a Custom Report
Click the report name under Custom Reports to open it. The columns depend on how the report was created.
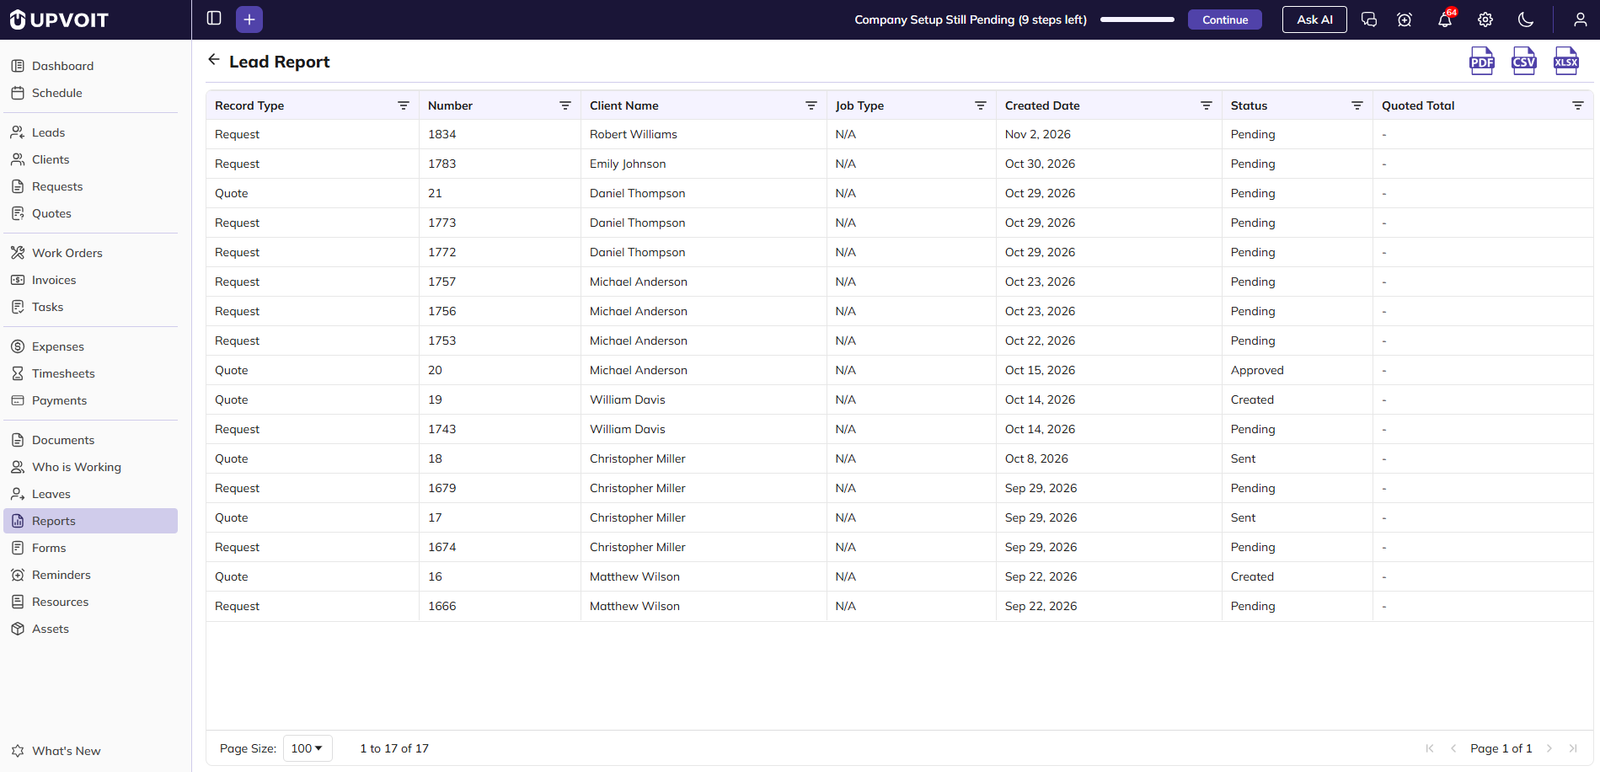
-
Search a column: Click the Filter icon in a column header, then type in the Custom Filter box to show only matching rows.
-
Sort: Click a column header to sort by that column. An arrow shows the sort direction.
-
Export: Download the report as PDF, CSV or XLSX using the icons at the top right.
-
Page Size: Show 20, 50 or 100 rows per page using the dropdown at the bottom left. Use the arrows at the bottom right to move between pages.
Deleting a Custom Report
-
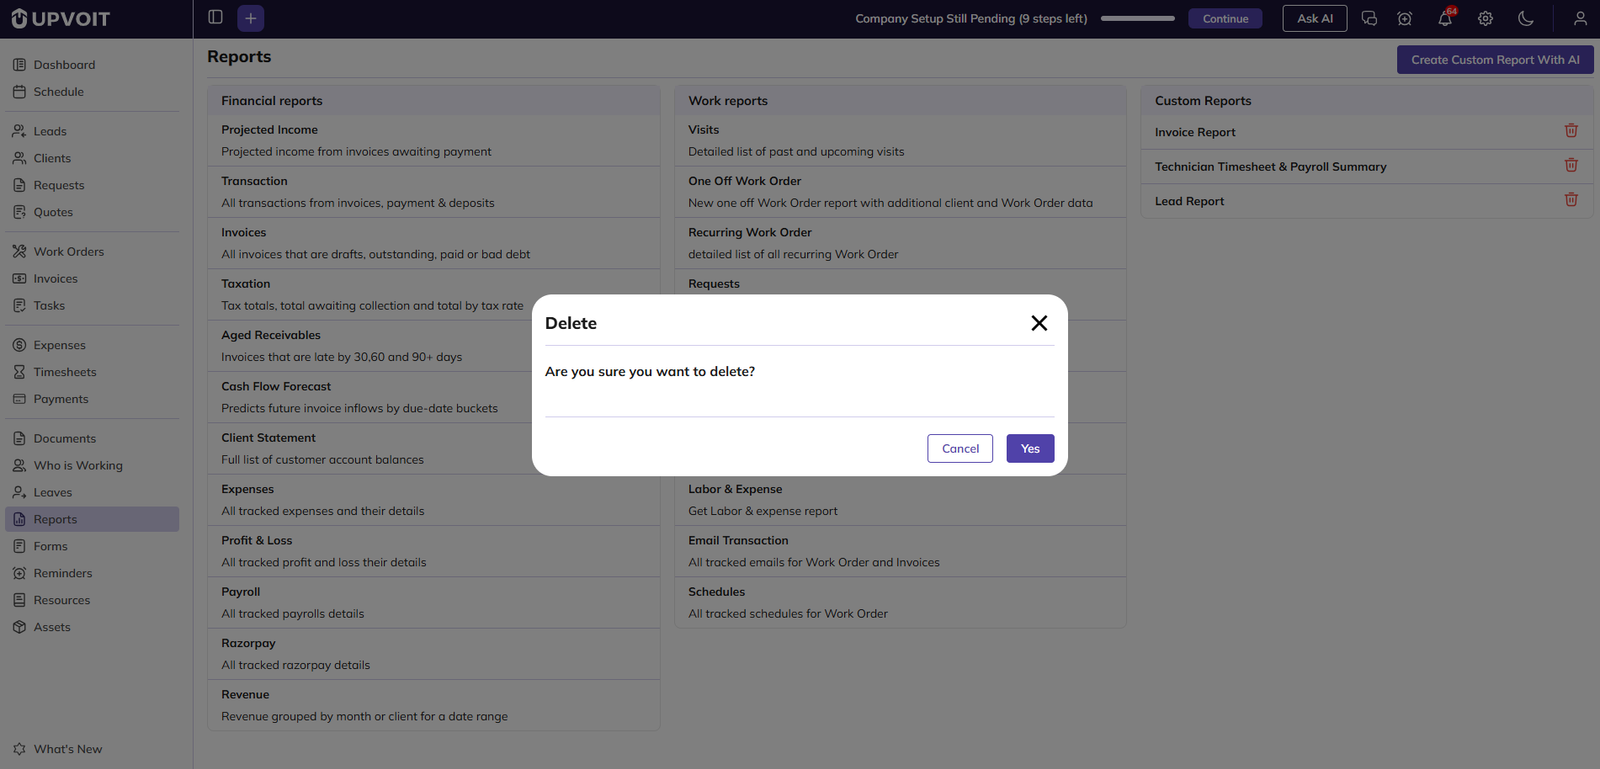
Click the Delete (bin) icon next to the report name.
-
In the Delete pop-up, click Yes to confirm, or Cancel to keep the report.
Did this answer your question?


