
Dashboard Overview
The Dashboard is the first screen users see after logging in. It gives a quick picture of the business: open requests, quotes, jobs, invoices, today’s appointments and financial trends. Upvoit has three types of dashboard:
-
Dashboard: The default operational view, showing day-to-day work across Requests, Quotes, Jobs and Invoices.
-
Business Dashboard: A financial and performance view with charts, status summaries, staff activity and a technician leaderboard.
-
Custom Dashboard: A dashboard you create and name yourself, then fill with widgets generated by Upvoit AI.
Note: Admin users see every card. Other users see only the cards for modules they have permission to access.
Dashboard (Default View)
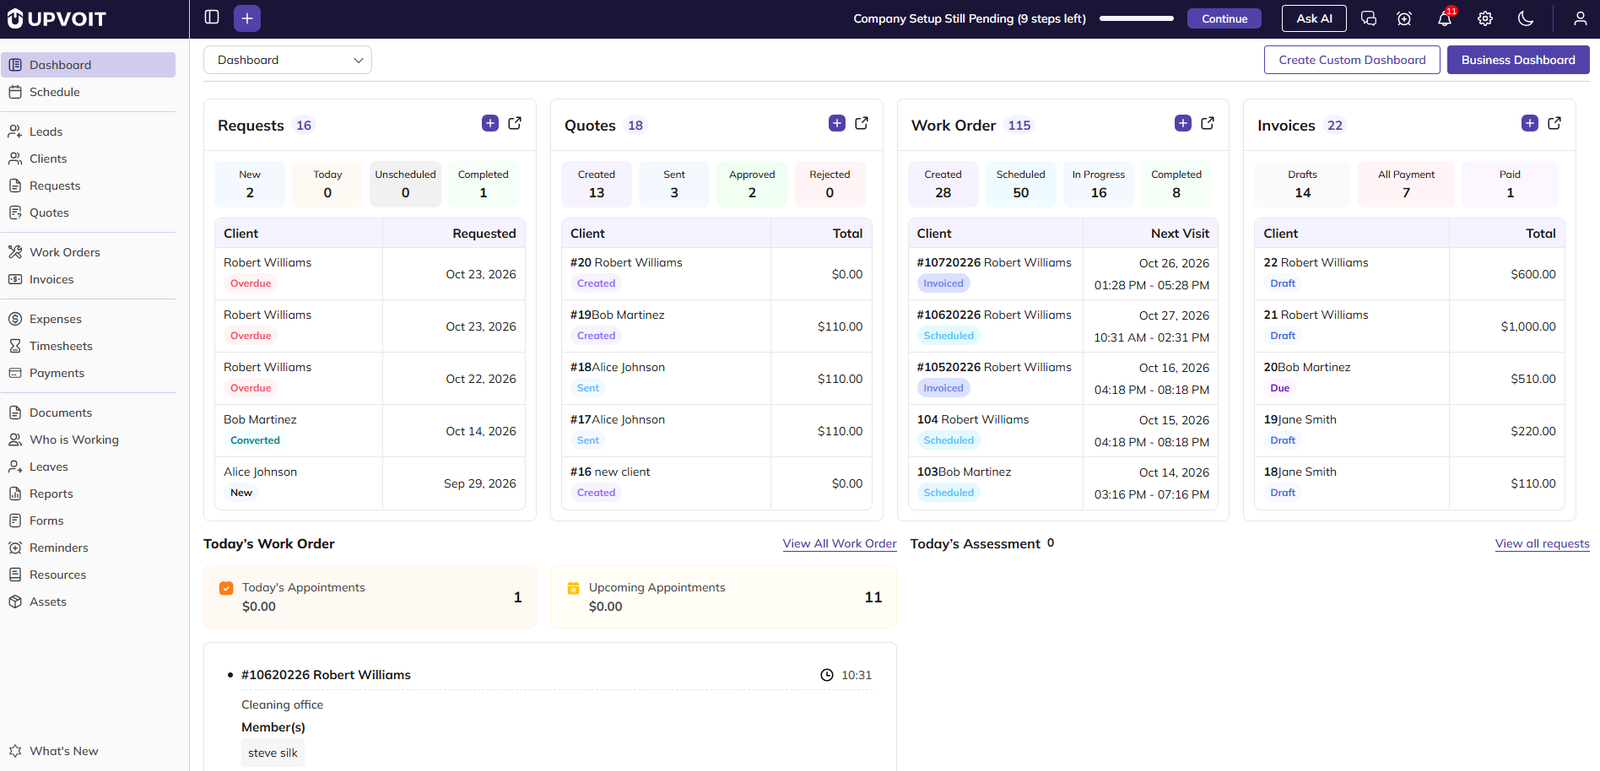
Top Bar
-
Dashboard Selector: Switch between the Dashboard, the Business Dashboard and custom dashboards.
-
Create Custom Dashboard: Create a new custom dashboard (see Section 3).
-
Business Dashboard: Open the Business Dashboard.
Module Cards
Each card shows the total count, status tiles and the latest five records.
-
Requests: New, Today, Unscheduled and Completed.
-
Quotes: Created, Sent, Approved and Rejected.
-
Job: Created, Scheduled, In Progress and Completed.
-
Invoices: Drafts, All Payment and Paid.
-
+ / Open icons: + creates a new record, and the open icon goes to the module’s list.
Today’s Work
-
Today’s Job: Today’s and upcoming appointments, with today’s job list and assigned members.
-
Today’s Assessment: Requests with an assessment scheduled for today, with their date, time and assigned members.
Business Dashboard

Top Bar
-
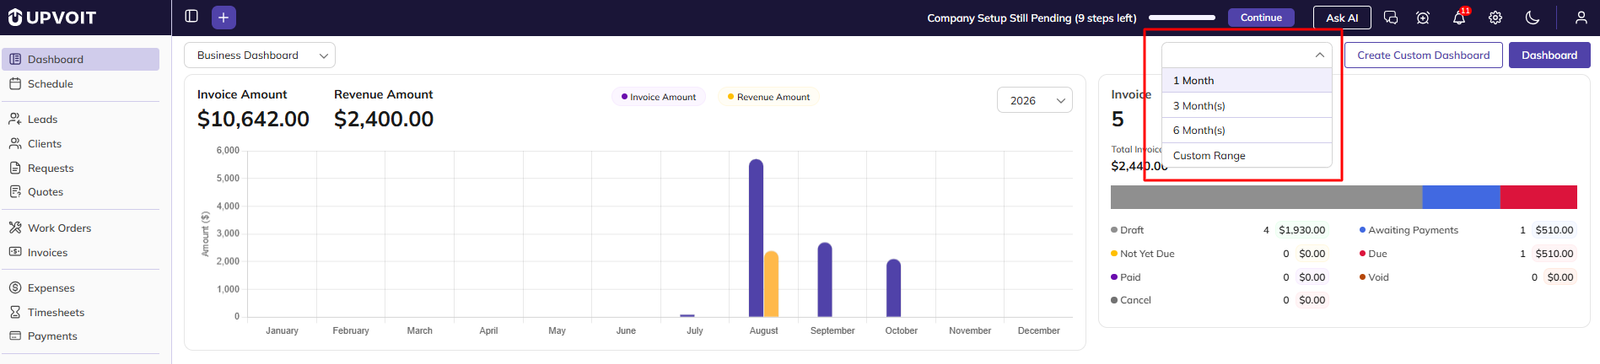
Period Filter: Set the time range for the Invoice and Quote summaries (see Section 2.1).
-
Create Custom Dashboard: Create a new custom dashboard (see Section 3).
-
Dashboard: Return to the default Dashboard.
Charts
Each chart shows monthly bars. Use its Year dropdown to change the year.
-
Invoice Amount vs Revenue Amount: Amount invoiced compared with revenue received.
-
Job Amount: Total value of jobs.
Summaries
Each summary shows the total count, the total amount and a colour bar with the count and amount for each status.
-
Invoice: Draft, Awaiting Payments, Not Yet Due, Due, Paid, Void and Cancel.
-
Quote: Created, Sent, Approved, Rejected, Expired and Pending Approval.
Team
-
Leave: Staff leave records. View All opens the Leaves module.
-
Who’s Working: Technicians currently clocked in, with their clock-in time and status. View All opens the Who is Working module.
-
Leaderboard: Technicians ranked by the number of jobs they have completed.
Period Filter
-
1 Month: Shows data for the last month. This is the default.
-
3 Month(s): Shows data for the last three months.
-
6 Month(s): Shows data for the last six months.
-
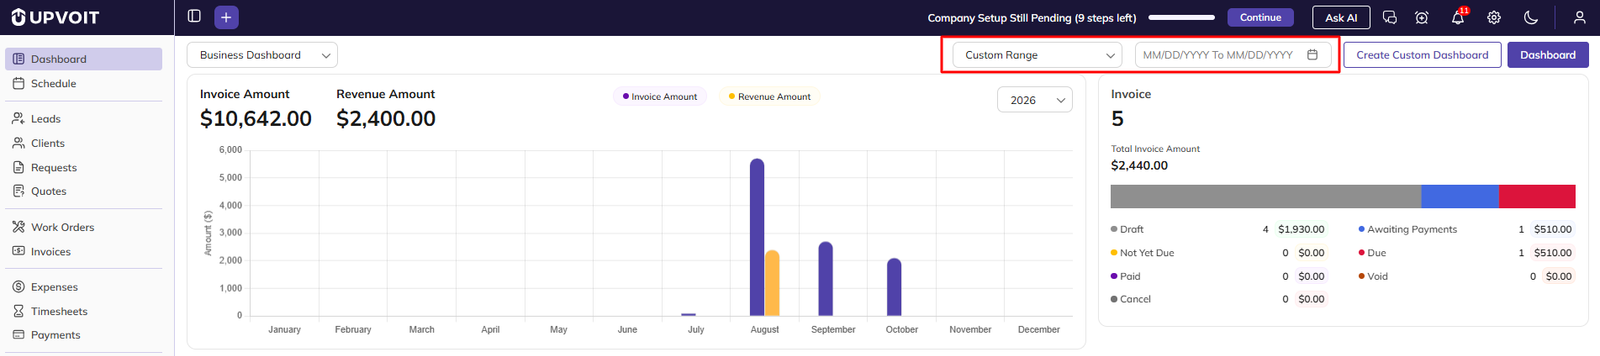
Custom Range: Shows data for dates you choose. See below.
-
Select Custom Range from the Period Filter.
-
Click the date field (MM/DD/YYYY To MM/DD/YYYY) and choose a start date and an end date.
-
The Invoice and Quote summary cards update to show data for the selected dates.
Custom Dashboard
A custom dashboard lets you build your own view by describing in plain language the data you want to see. Upvoit AI turns that description into a chart widget. Custom dashboards are visible to other users, not only to the user who created them.
Note: A custom dashboard cannot be renamed or deleted. Deleting all of its widgets leaves the dashboard empty, but its name stays in the Dashboard Selector. Choose the name carefully when you create it.
Create a Custom Dashboard
-
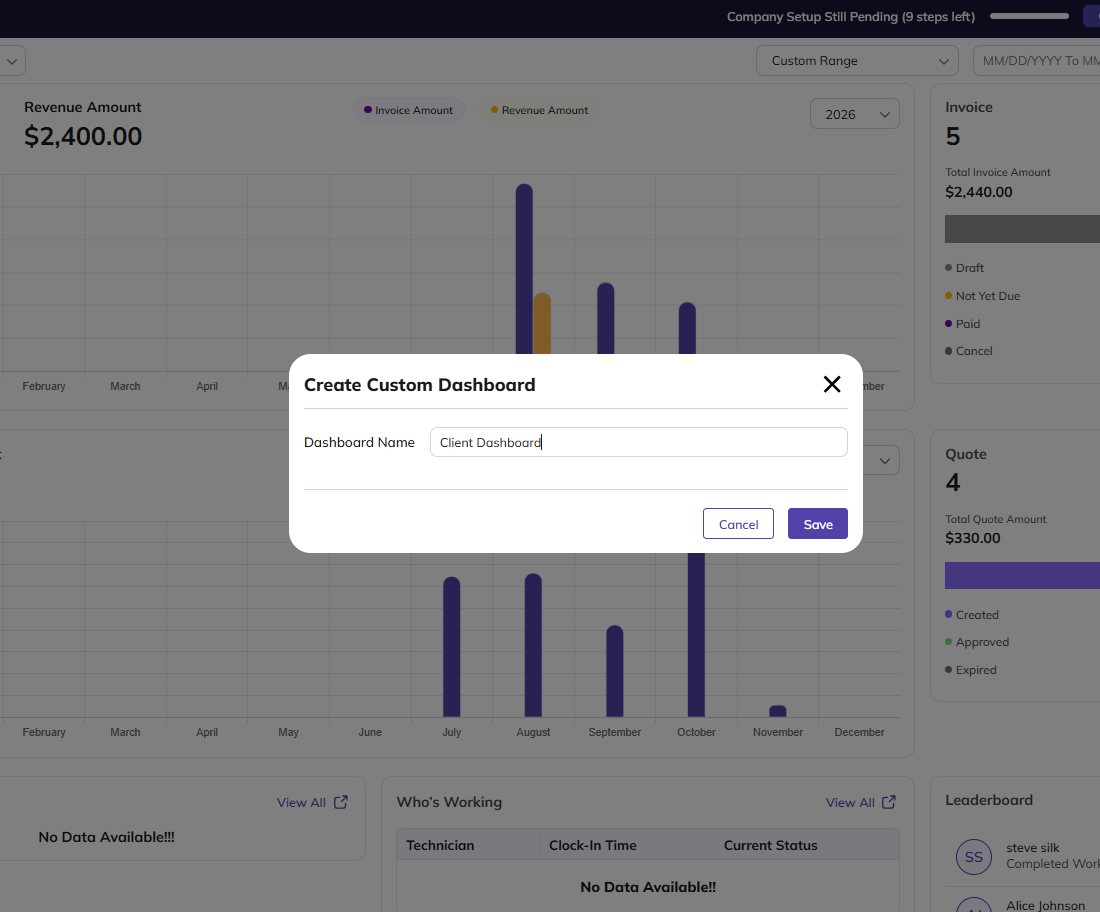
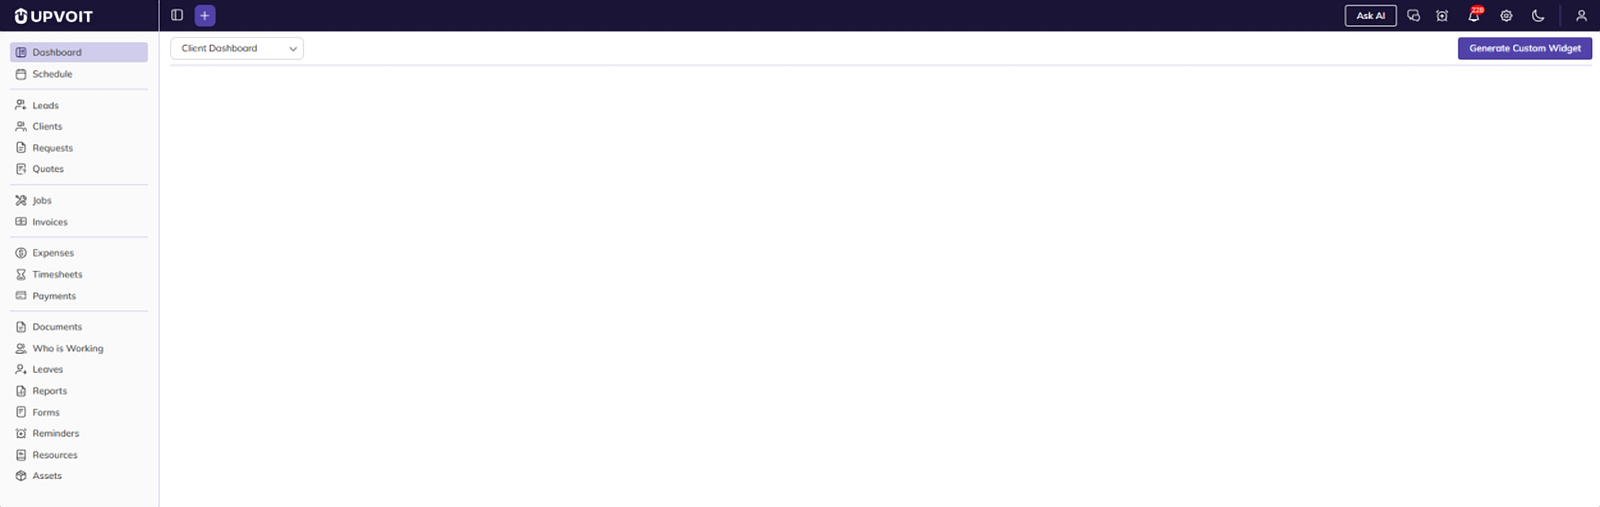
Click Create Custom Dashboard.
-
In Dashboard Name, enter a name for the dashboard.
-
Click Save. The new dashboard opens and also appears in the Dashboard Selector.
Generate a Widget
-
Click Generate Custom Widget. The Custom Dashboard (Beta) panel opens on the right.
-
In Ask Anything…, describe the widget you want. For example, “Create client dashboard” creates a client widget.
-
Click the Send icon. Upvoit AI generates a chart from your request.
Save the Widget and Layout
-
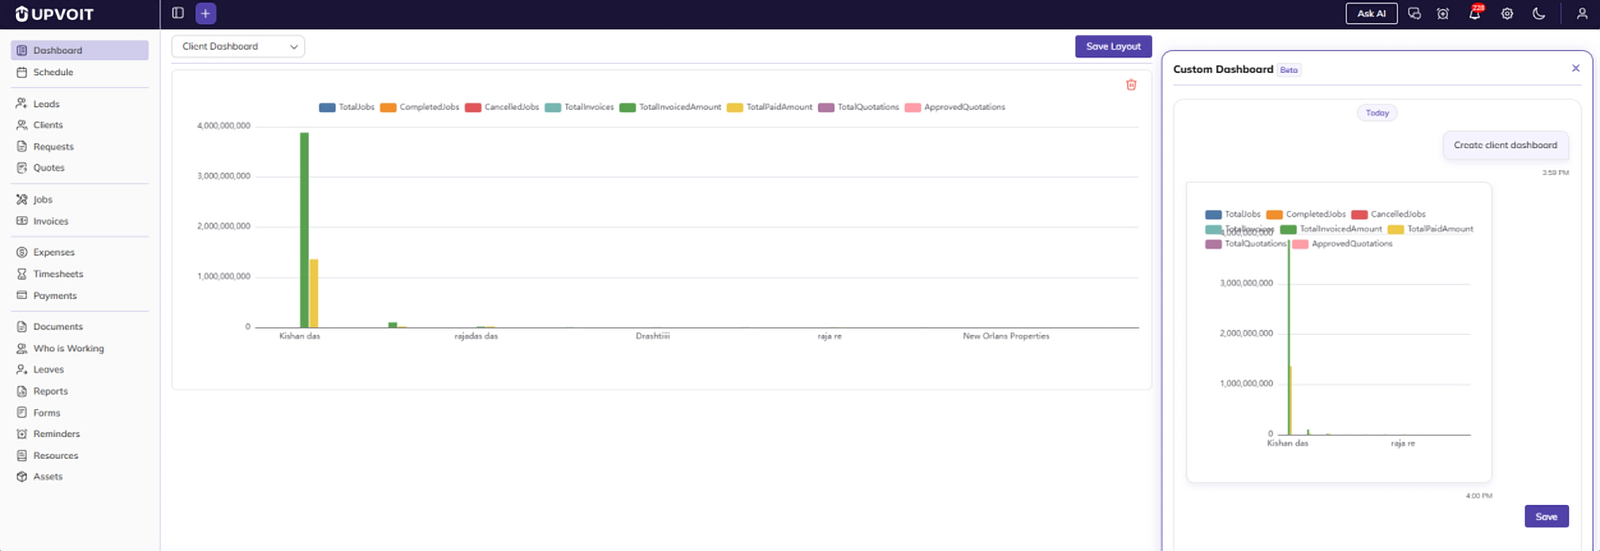
Widget on Dashboard: After you click Preview, the widget appears on the dashboard.
-
Save (in the AI panel): Adds the widget to the dashboard. After you click it, the Save button disappears.
-
Save Layout: Saves the current position and size of all widgets on the dashboard. The Save Layout button stays visible, so you can save again after making more changes.
Note: A widget cannot be edited once it is saved. To change a widget, delete it and generate a new one.
Arrange and Resize Widgets
-
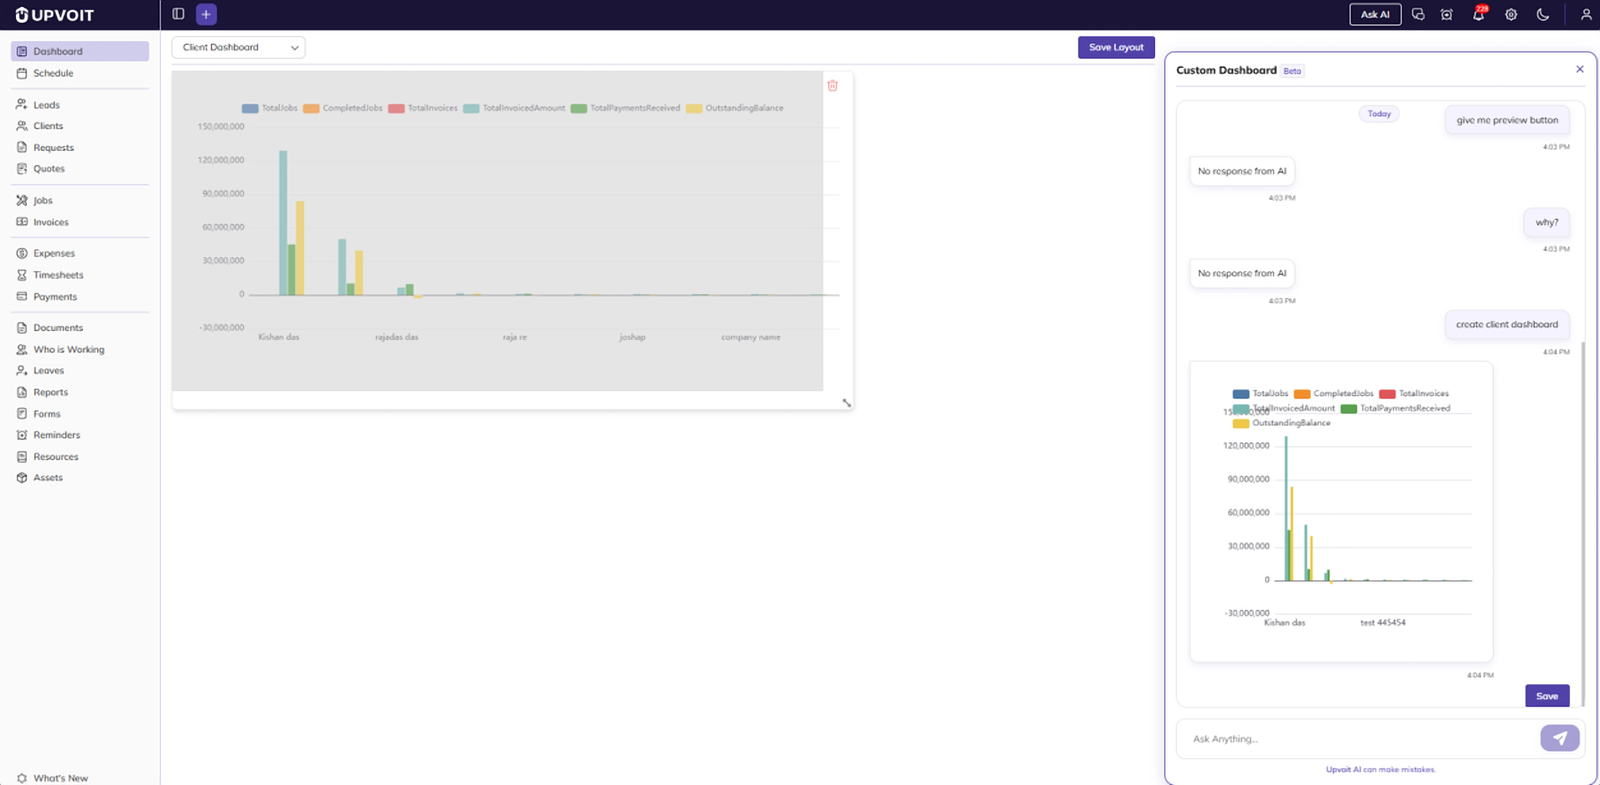
Drag area: Click and hold the widget, then drag it to a new position on the dashboard.
-
Resize handle: Drag the corner handle at the bottom-right of the widget to make it larger or smaller.
-
Delete: Removes the widget from the dashboard.
-
Multi-series chart: A single widget can show several measures at once. For example, it can show Total Jobs, Total Invoices, Total Invoiced Amount and Total Payments for each client.
After moving or resizing widgets, click Save Layout to keep the changes.
Tip: Upvoit AI can make mistakes. Check that each generated chart shows the data you expected before you save it.
Did this answer your question?


