AI Assistant Module
The AI Assistant is your intelligent companion for accessing business data instantly through natural conversation. Ask questions in plain language and receive immediate answers without navigating multiple modules or applying filters.
Getting Started with AI Assistant
How to Access
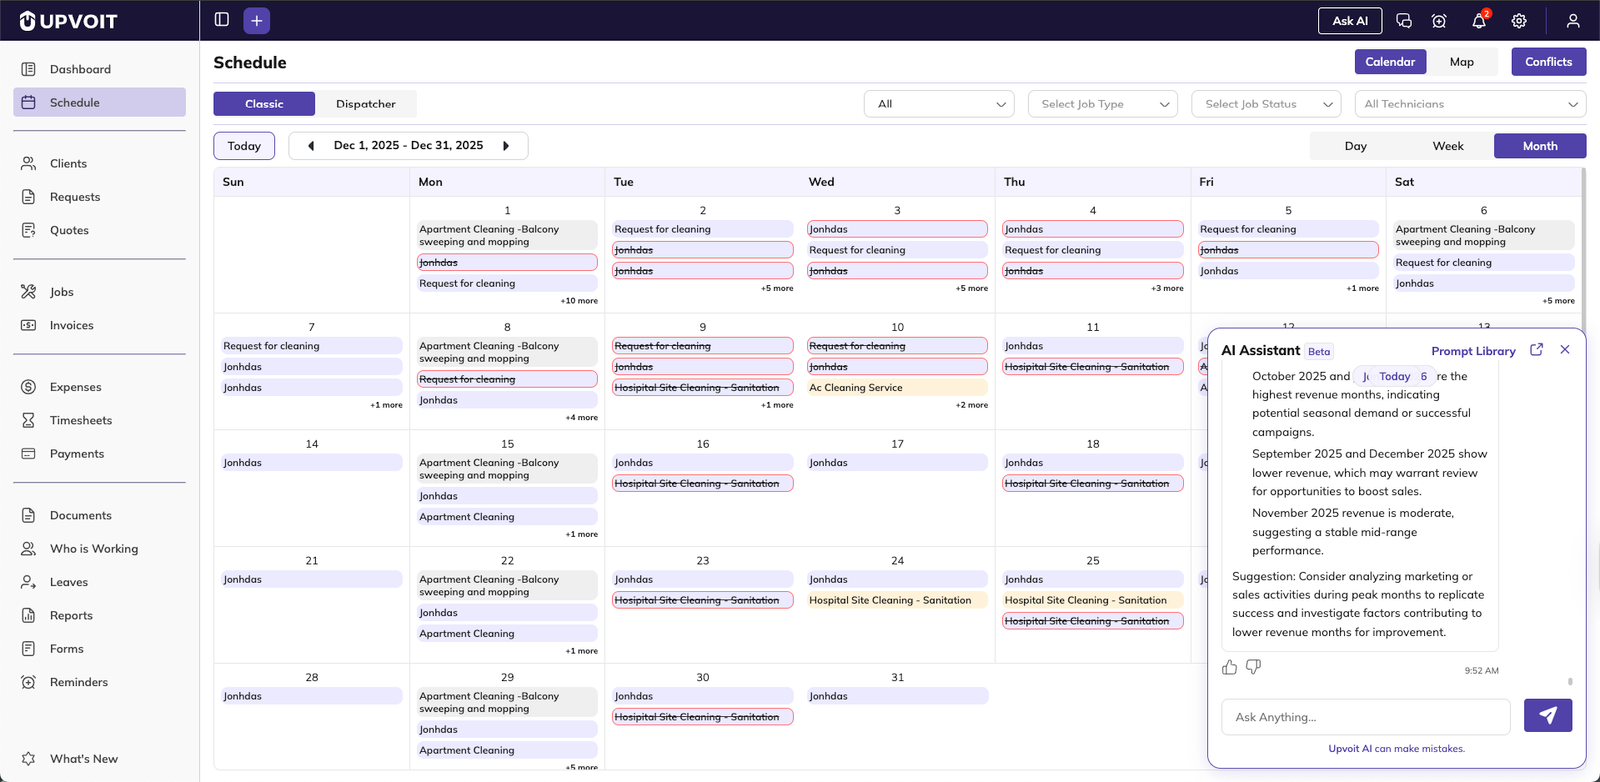
Click the “Ask AI” button in the top header of any page. This opens a chat popup where you can type your questions directly.
Full-Screen Mode
For a larger workspace, click the full-screen icon at the top of the chat popup. This expands the AI Assistant into a full window, giving you more space to view responses, charts, and data.
Chat Interface
Input box at the bottom – Type your questions here
Response area – View answers, data, and visualizations
History panel – Access previous conversations
Like/Dislike buttons – Rate responses to improve accuracy
Data Privacy and Security
Your Data Stays Private — Many users wonder if their business data is shared with AI companies. It isn’t.
How It Works:
AI is used only to convert your question into a database query
The actual data is fetched directly by the Upvoit application, not by the AI
Your data always stays inside Upvoit
Data is never exposed to any external AI service
What This Means:
Your client information remains confidential
Financial data stays secure within your account
No third-party AI services access your business data
AI only understands the question structure, not your actual data
Asking Questions
Natural Language Queries
Simply type questions as you would ask a colleague. No special syntax or commands needed.
Financial Questions
“What is the total invoice amount for this year?”
“What’s the total expense for this month?”
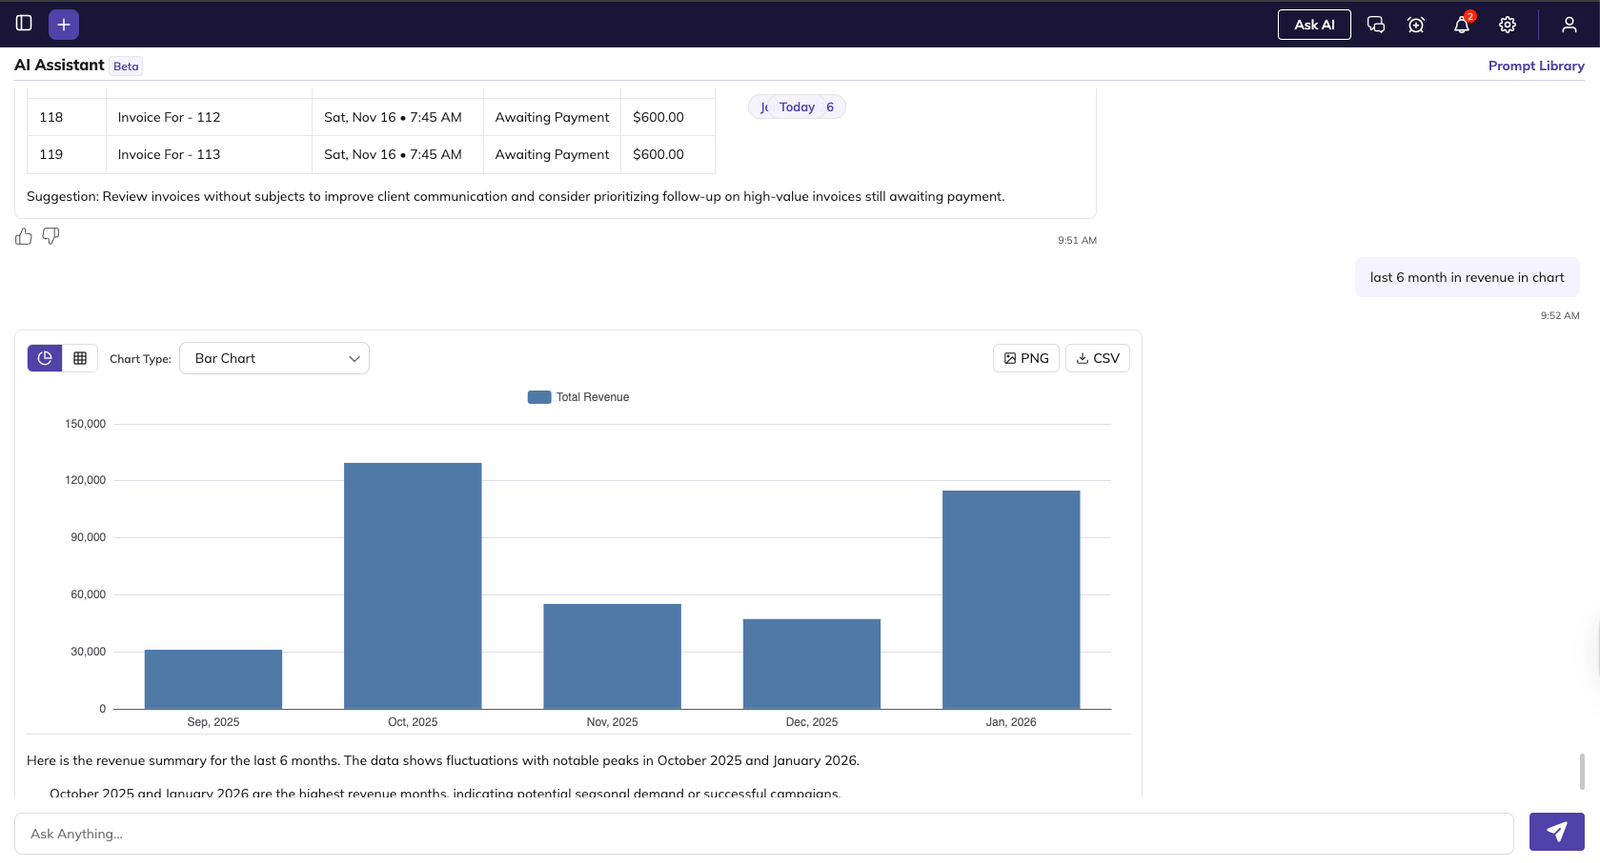
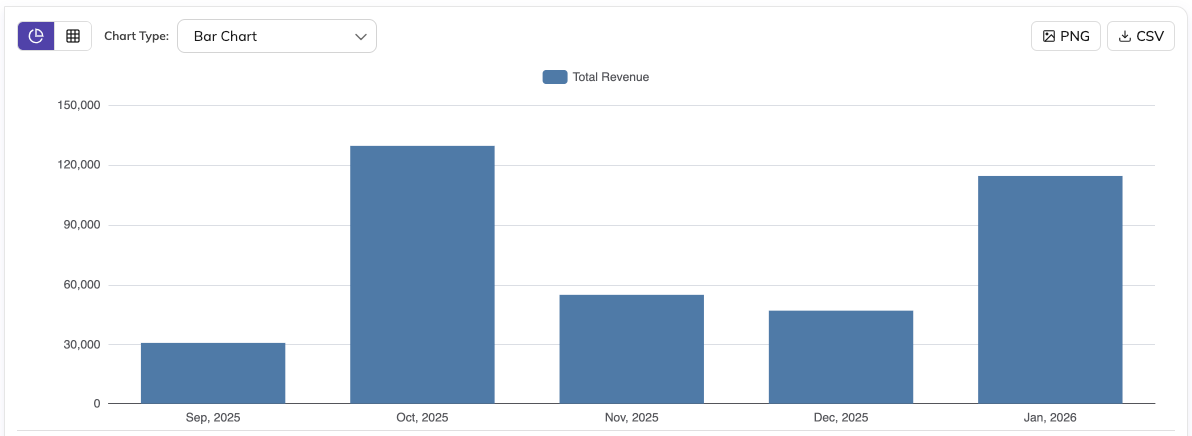
“Show me revenue trends for the last 6 months”
“How much did we spend on materials last quarter?”
“What’s our outstanding payment balance?”
Client and Project Questions
“How many active clients do we have?”
“Show me all jobs for ABC Company”
“What requests are overdue?”
“List all completed jobs this week”
Team and Payroll Questions
“Who is working today?”
“Show me total payroll for January”
“How many hours did John log this week?”
“What’s the average overtime this month?”
Supported Modules
The AI Assistant can answer questions about all key areas:
Clients – Customer information and history
Dashboard – Overview metrics and summaries
Expenses – Spending and cost tracking
Invoices – Billing and payment status
Leaves – Time off and availability
Payments – Transaction records
Payroll – Employee compensation
Reminders – Scheduled notifications
Reports – Custom data analysis
Requests – Service requests pipeline
Revenue – Income and earnings
Settings – Configuration options
Users – Team member information
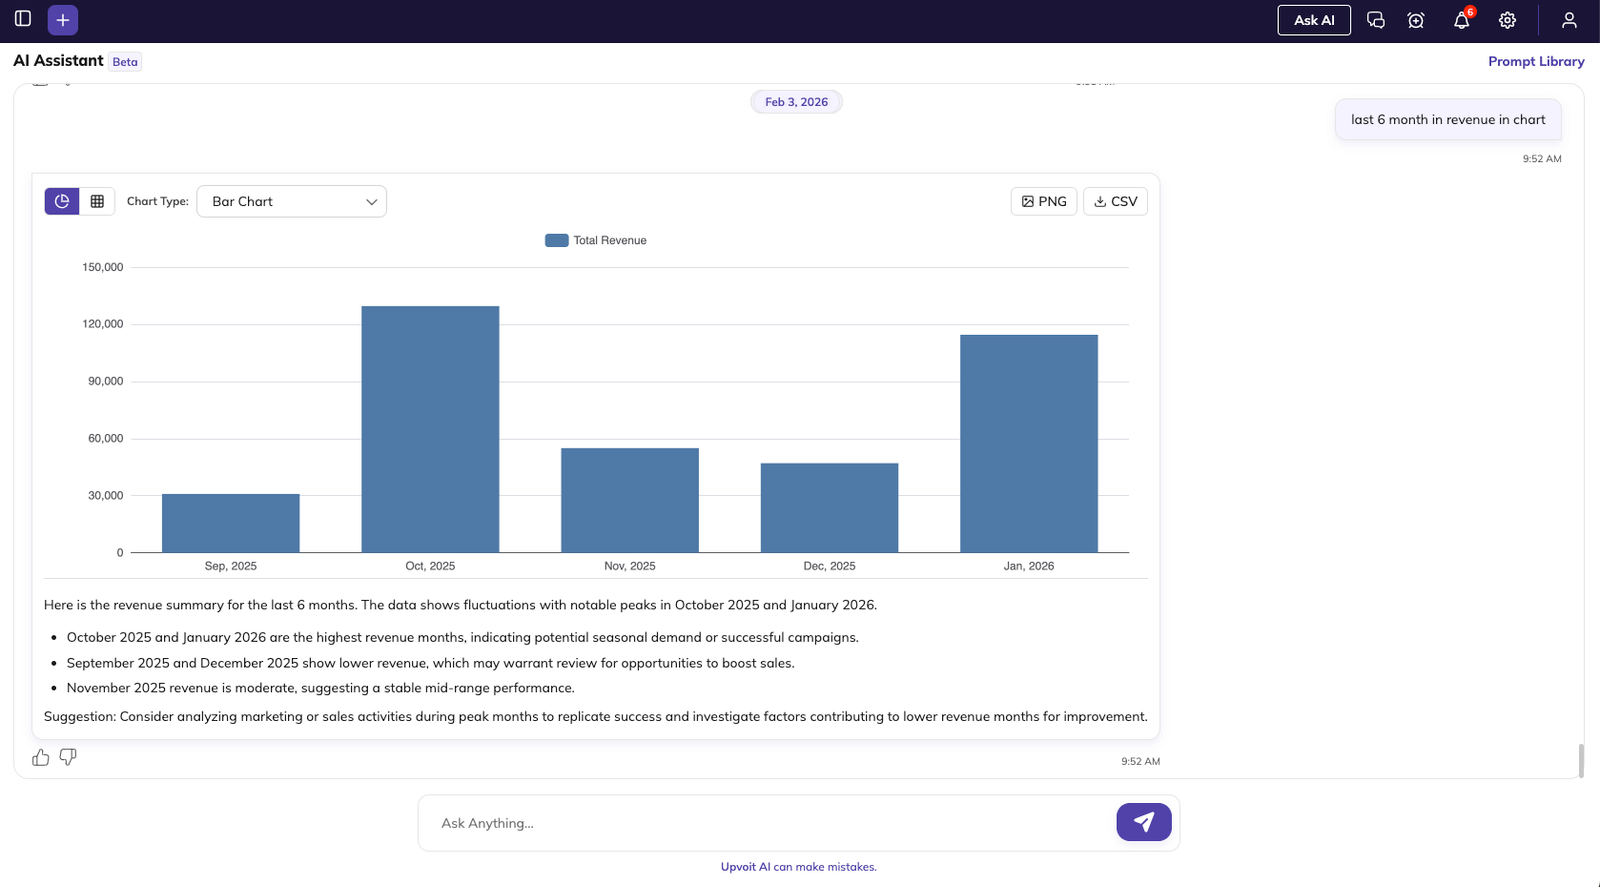
Visual Reports and Charts
Generating Graphs
Ask the AI Assistant to create visual representations of your data.
Example Prompts:
“Give me a graph showing the total income for the previous year, broken down by month”
“Create a chart of expenses by category this quarter”
“Show me job completion rates as a graph”
“Display revenue trends for the last 12 months”
Switch Graph Types
Use the dropdown menu to change between:
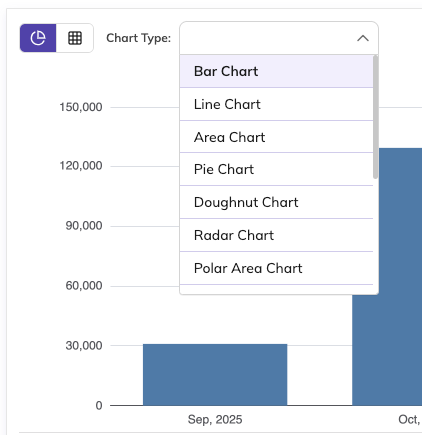
Bar charts
Line graphs
Pie charts
Area charts
And more
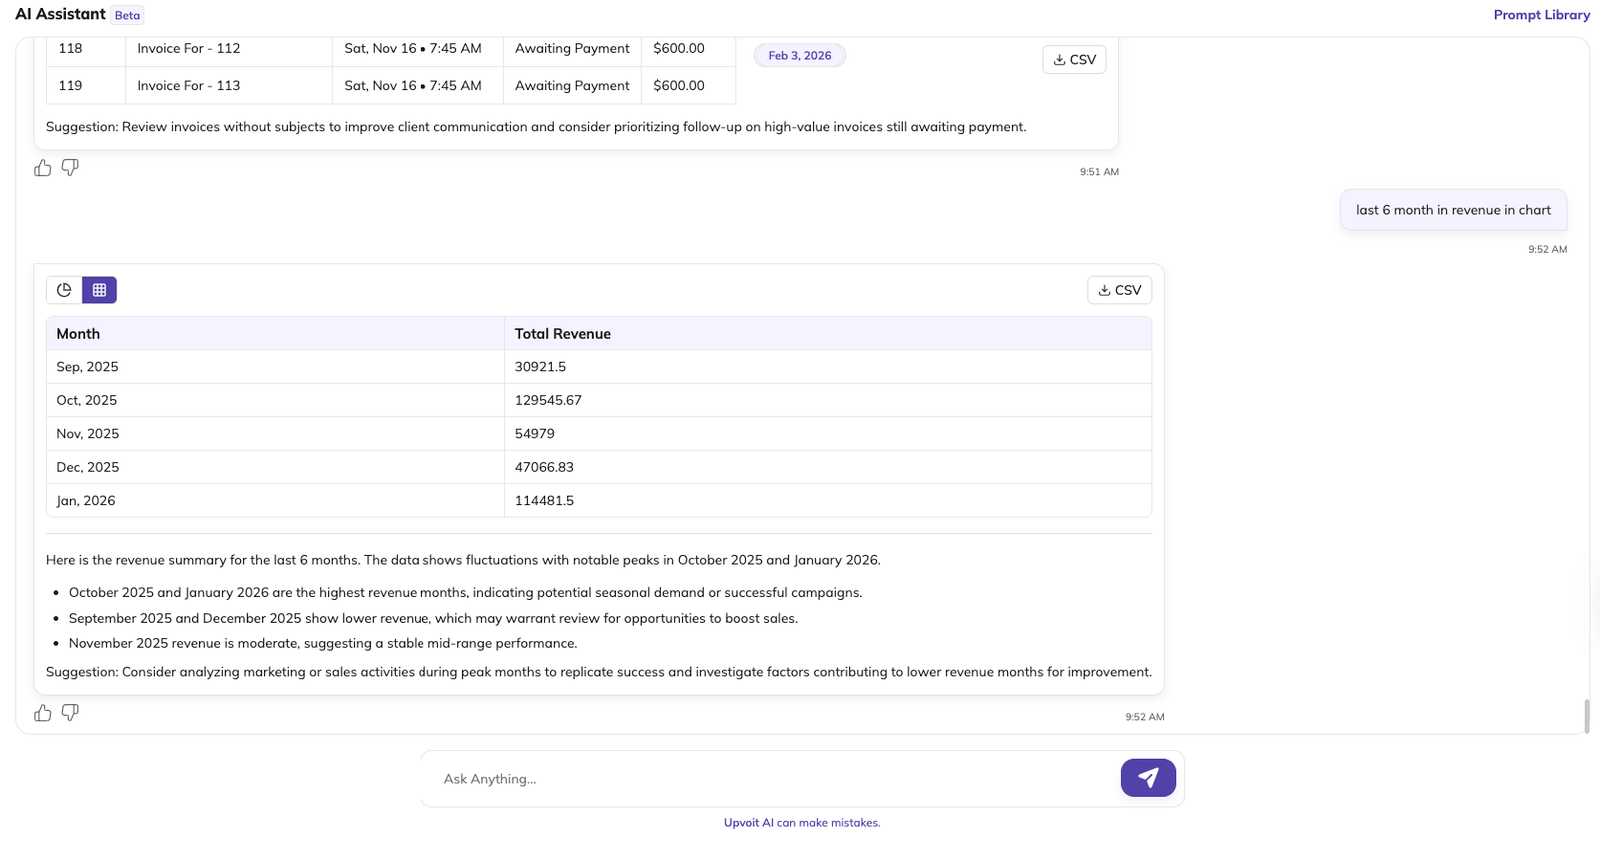
Toggle Views
Switch between:
Graph view – Visual representation
Table view – Detailed data rows
Download Options
Export your visualizations in multiple formats:
PNG – Image file for presentations or documents
CSV – Spreadsheet format for further analysis
XLSX – Excel format for detailed work
Prompt Library
The Prompt Library is a collection of pre-built questions organized by category to help you discover what the AI Assistant can do.
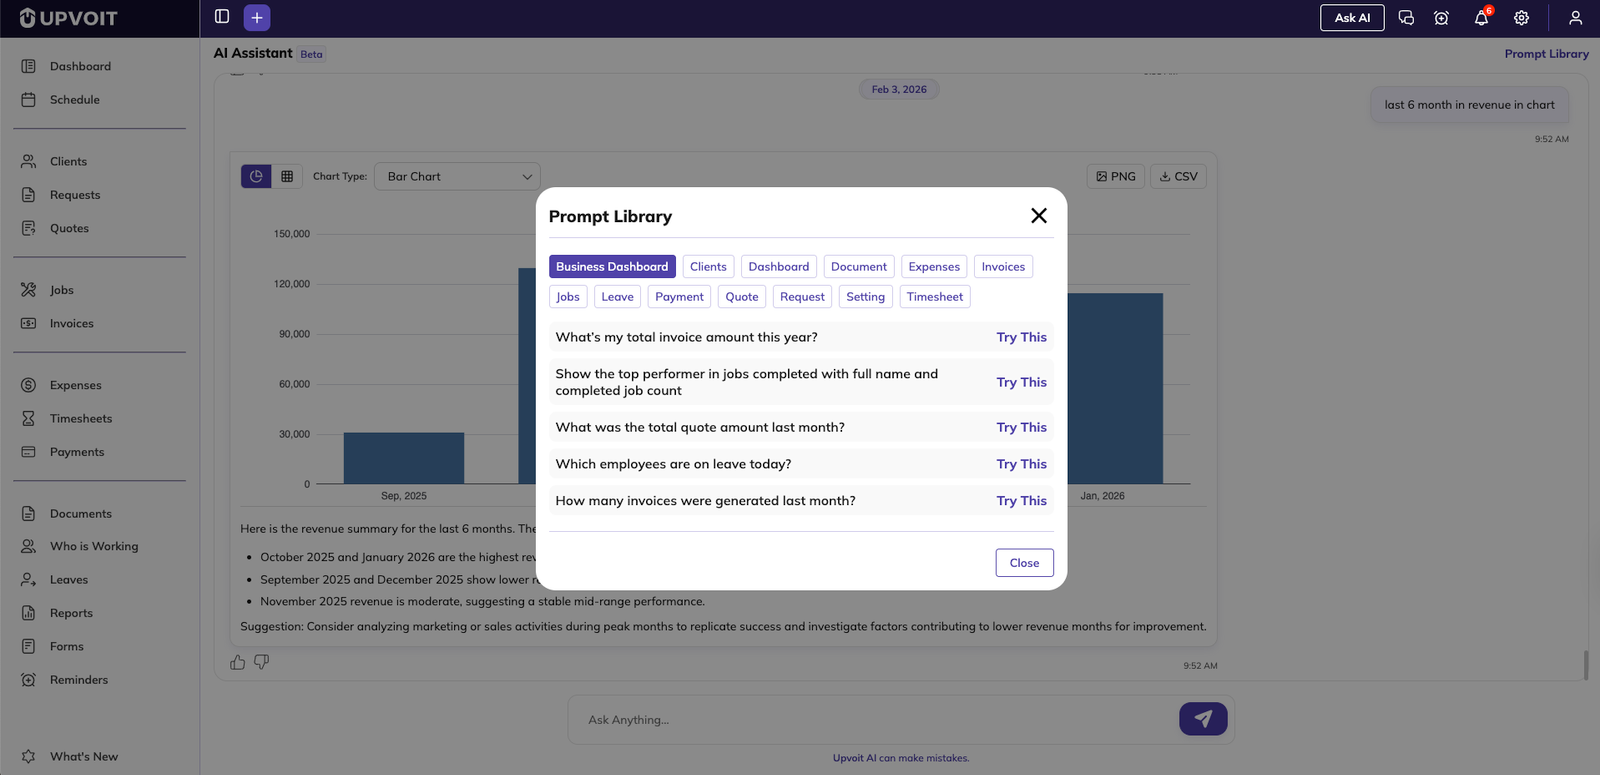
How to Use It:
Click the Prompt Library button in the AI Assistant
Browse prompts organized by category: Clients, Dashboard, Expenses, Invoices, Jobs, Payments, and more
Click any prompt to automatically run that question
Results appear immediately in the chat
Benefits:
Learn what questions you can ask
Discover hidden insights in your data
Save time with ready-made queries
Get inspired for custom questions
Improving AI Responses
Rating System
Every AI response includes Like and Dislike icons.
Why Rate Responses?
Your feedback helps the AI Assistant learn
Improves accuracy over time
Ensures better answers for future questions
Helps refine understanding of your business needs
When to Like:
Answer is accurate and complete
Data matches your expectations
Format is clear and helpful
When to Dislike:
Answer is incorrect or incomplete
Data doesn’t match what you expected
Response format isn’t useful
Chat History
View all your past questions and answers whenever you open the AI Assistant screen.
Features:
Scroll through previous queries
Reference past answers
Re-run previous questions
Track your analysis over time
Benefits:
Don’t re-type the same questions
Compare data across different time periods
Share conversation history with team members
Document your decision-making process
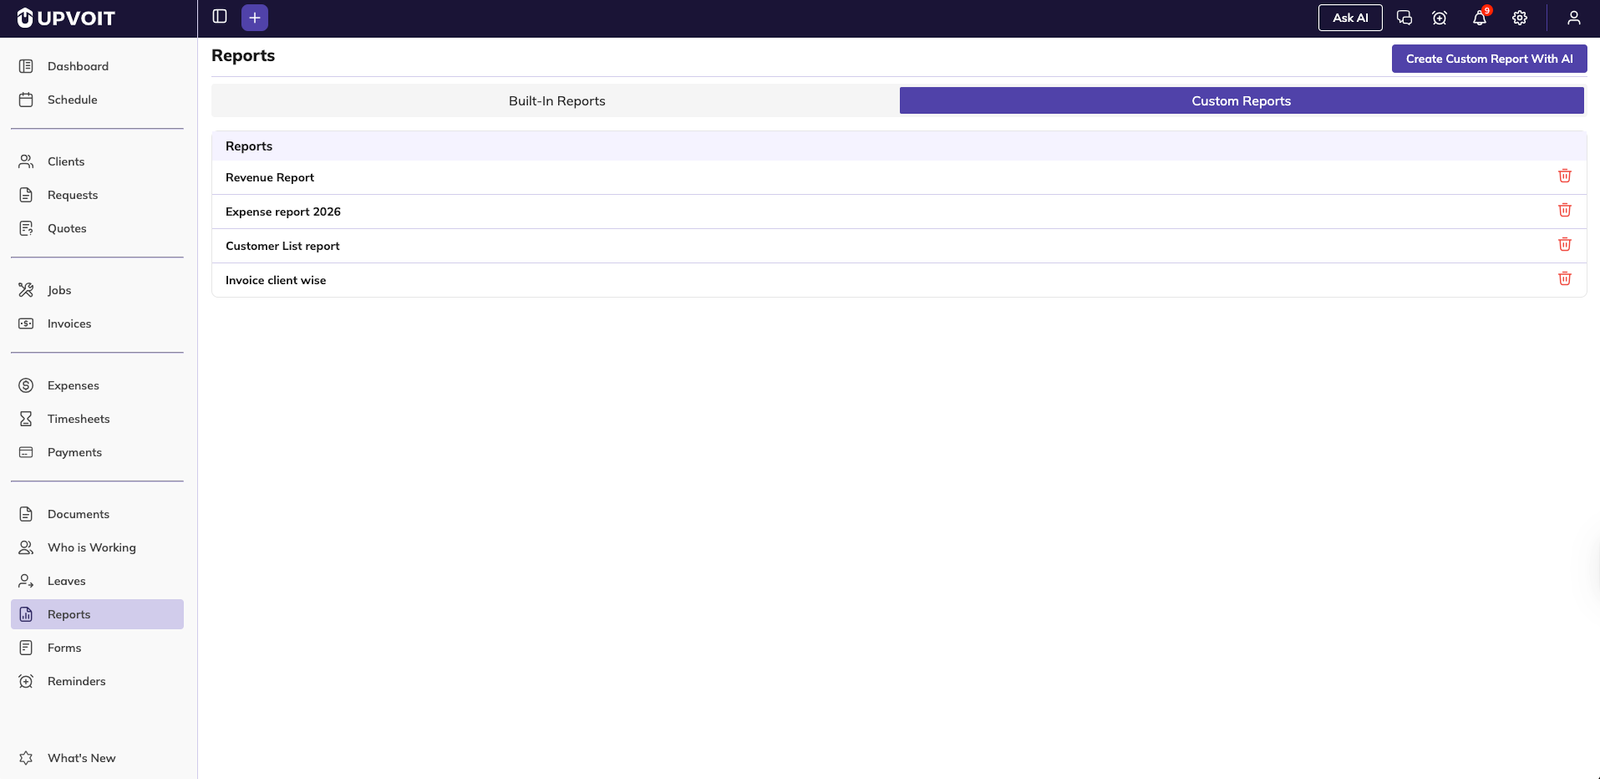
Creating Custom Reports with AI
Build tailored reports using natural language instead of manually configuring filters and columns.
Step-by-Step Process
Access Custom Reports: Go to Reports from the side menu, switch to the Custom Reports tab, and view the list of AI-generated reports.
Create New Report: Click “Create Custom Report With AI” at the top-right.
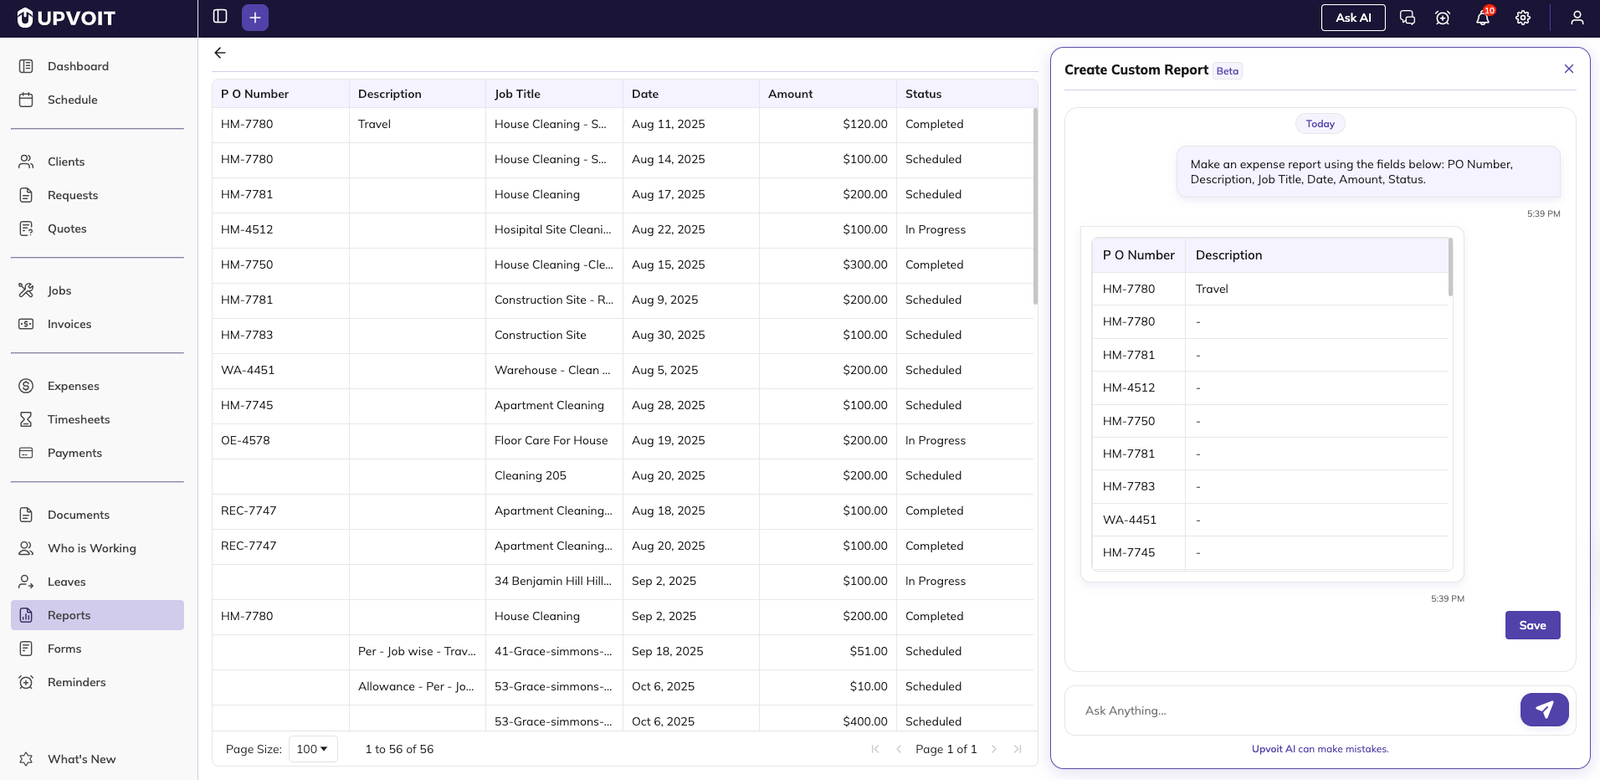
Interface Layout: Left side – Data grid showing preview. Right side – AI chat panel. Bottom – Input box for your instructions.
Describe Your Report: Type a prompt explaining what you need. Be specific about fields.
Preview Generated Report: The AI Assistant analyzes your data, builds a preview table with requested columns, shows results immediately, and fills matching rows with live data.
Refine the Report: Give another instruction in the same chat if needed.
Save the Report: Click Save, enter a clear report name, and save again. The report appears in the Custom Reports list.
Example:
“Make an expense report using the fields below: PO Number, Description, Job Title, Date, Amount, Status”
Refinement Examples:
“Remove Description”
“Add Client Name column”
“Sort by Date descending”
“Only show amounts over $1000”
Interface Layout
Working with Saved Custom Reports
Go to Reports → Custom Reports and click any saved report name to view the latest data in the same structure the AI created.

Live Data: Reports always show current data, not a snapshot. Each time you open a report, it pulls the latest information.
Delete old or unused reports using the delete icon on the right of each report row to keep your list clean and focused.
Filtering and Sorting Custom Reports

Column Filters
When viewing a custom report, click the filter icon beside any column header. A text box appears, type to search, and the table shows only matching rows.
Use Cases:
Find specific client names
Filter date ranges
Search for job types
Locate specific amounts
Sorting Data
Click any column header to sort by that field: first click sorts ascending (A-Z, 0-9, oldest to newest), second click sorts descending (Z-A, 9-0, newest to oldest).
Exporting Custom Reports
Export your custom reports from the top of the screen in multiple formats:
PDF – Professional presentation format; fixed layout for printing; best for sharing with clients or management
CSV – Comma-separated values; opens in any spreadsheet software; best for data manipulation
XLSX – Native Excel format; preserves formatting and structure; best for detailed analysis and further calculations
Example Use Cases
Financial Decision Making
“What’s our cash flow for the last 3 months?”
Generate monthly revenue graphs to identify trends
Export expense reports for accounting review
Team Management
“Who has available hours this week?”
“Show me overtime by employee this month”
Create custom payroll reports by date range
Client Analysis
“Which clients have the most active jobs?”
“Show me payment history for XYZ Company”
Generate client revenue reports for account reviews
Project Tracking
“How many requests are pending conversion?”
“What jobs are overdue?”
Create job completion reports by technician
Use Follow-Up Questions
If the first answer isn’t perfect, refine it:
“Now show only amounts over $5000”
“Remove the description column”
“Sort by date newest first”
Troubleshooting
“No data found”
Check your date range – data might exist outside the period
Verify filters aren’t too restrictive
Confirm you have data in that module
Unexpected Results
Rephrase your question more specifically
Break complex questions into smaller parts
Use the Dislike button to help improve future responses
Can’t Find Specific Information
Try browsing the Prompt Library for similar questions
Ask in smaller steps (first get the list, then filter it)
Check that the data exists in the relevant module
Did this answer your question?


